The Most Feminine Country in the World

May 8, 2014
The Swedish Model

The Swedish Model

Mars, Venus, and All That

Continuing on the theme of culture and personality, I’ve noticed that social psychologist Geert Hofstede has found Sweden to be the most feminine country in the world according to his theory of cultural dimensions. Apart from masculinity/femininity, these dimensions – that he also views as personality traits, at least judging by his website – also include individualism/collectivism, uncertainty avoidance, power distance (strength of social hierarchy), long-term orientation, and indulgence/self-restraint. But in this post I’m going to focus on the gender dimension in this post. Is Sweden the most feminine country in the world?

As a Swede myself, I think this might be true, but it all depends on your definition of course. Here is how Hofstede defines it on his website,

The masculinity side of this dimension represents a preference in society for achievement, heroism, assertiveness and material rewards for success. Society at large is more competitive. Its opposite, femininity, stands for a preference for cooperation, modesty, caring for the weak and quality of life. Society at large is more consensus-oriented.

As all definitions, this one can be criticized. Women have part of achievement too – in a world of global capitalism you may argue that being modest and caring for the weak are big achievements. And men don’t necessarily look for material rewards, as can be seen in the case of for instance psychologist Hans Eysenck, composer Arvo Pärt or architect Antoni Gaudi. But overall, there is probably something to the general idea that men are competitors and doers and that women are caring and cooperative.

One way to validate this dimension would be with measures of gender equality, since we should expect feminine cultures to have more gender equality. Here is Hofstede’s measure compares to the Gender Inequality Index (GII) and the Global Gender Gap Index (GGGI),

Untitled


As you can see, there are clear similarities between these indices. The Nordic countries and the Netherlands (which is culturally similar to those countries) make up 5-6 spots of the top ten on all three.  Outside this zone the measures start varying with some European, Anglosphere and Latin American countries. So the Nordic region plus the Netherlands is where femininity is the strongest. I’ll refer to this as the Feminine region from now on.

The Difference between WEIRD and Feminine

This may come as a bit of a surprise since femininity and the related concept of gender equality appear to be an integral part of the Enlightenment legacy that is mostly found throughout Northwest Europe and the Anglosphere, sometimes given the acronym WEIRD (as in Western, Educated, Industrialized, Rich, and Democratic), a region characterized by its civic-mindedness, human rights and lack of corruption. And while the Feminine region is within the WEIRD region it’s only one half of it with the Anglosphere with countries like America, Australia, and Great Britain making up the other half, which is no where near as feminine.

So it seems not all children of Enlightenment are created equal. I don’t think I’ve ever heard anyone explain or even mention this divide (although someone has probably mentioned it). If, as I suggested in my previous post, culture is ultimately the collective manifestation of our individual personalities, this would have to be a mainly genetic divide, perhaps created by different selective pressures within Northwest Europe. One possible explanation would be that farming in the Nordic countries, with its much harsher climate and long winters, would make flexibility in gender roles a fitness trait. The combination of scarcity of resources and the high energy costs of a cold climate means that margins are small even under normal circumstances. If your wife is too ill to milk the cows and your children won’t survive without the milk, then you have to be flexible and sometimes do women’s work.

Health Care

So, is femininity a good thing, besides for milking cows? Are these countries really more caring and cooperative? A society level measure of caring might be quality of health care. This can be highly subjective since health is made up of many subfactors not always easy to quantify into numbers. And poor health can be largely self-inflicted by people we don’t necessarily think of as weak. To get around these problems I went with child mortality. If we compare the Feminine region with the Anglosphere we also have the benefit of comparing otherwise very similar countries. Acording to a recent report published in the Lancet with estimates of  mortality rates for children under five years of age (deaths per 1000 live births for the year 2013), we have the following,

mortality


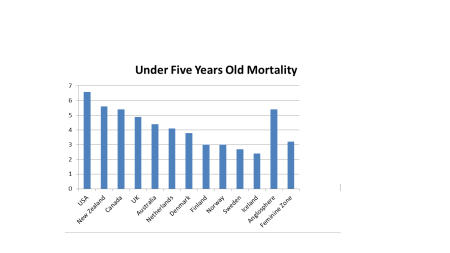
Compared to the Feminine region, the Anglosphere has a mortality rate that is 70 percent higher, and there is no overlap between these groups of countries. It may seem like a small difference compared to sub-Saharan Africa, but it’s striking to have such a difference between rich Northwest European countries (or their descendants).

Udate: Jayman wondered about whether race may be a factor for American mortality. According to CDC, first year mortality per 1000 births for White Americans is 5.11 so it’s roughly on the same level as the rest of the Anglosphere, especially given that the figures above are for the first 5 years. (Black 1-year infant mortality is at 11.42.)

Consensus versus Majoritarian Democracy

The other main aspect of femininity, cooperation, is something that is found in the political systems of these countries. The Feminine region is characterized by consensus democracy, especially in the sense that these countries have proportional electoral system, lots of political parties that form coalitions and with the ambition of getting broad support for decisions, not just within coalitions but with opposition and other interest groups and institutions. It’s the friendly, inclusive, and cooperative way of governing.

In contrast, the Anglosphere is characterized by the majoritarian model (see the link above) in which countries have fewer parties, form less coalitions with often just a single party in government at a time. The government also focuses more on their own agenda with less concern for and compromise with other parties, interest groups etc. It’s the competitive and take-charge way of governing.

Unlike with child mortality, it’s not obvious which of these models is the better; it depends on the situation and what you look to accomplish. Polls on how content people are with democracy and government do not show either of these models to be more popular than the other. But this offers more support to the idea that the WEIRD countries, while being very similar in other ways, differ in ways that can be described as masculine and feminine.

The Feminine Madness

Overall, femininity seems like a fairly good thing, seeing as how the most feminine countries in the world are wealthy, healthy and democratic.But what happens at the extreme ends of the spectrum? Just as for individual personalities you get crazy and maladaptive behavior. This can be seen in Sweden, where feminism has become so dominant that any critique is viewed as backward-minded bigotry by definition. The lack critique creates a sort of unsupervised playground for all sorts of crazy. According to a recent poll, 2.3 percent of the voters favoured the feminist party Feminist Initiative in the upcoming election to the European Parliament. Here is what one of their leaders said in 2002,

“The discrimination and the violations appears in different shapes depending on where we find ourselves. But it’s the same norm, the same structure, the same pattern, that is repeated both in the Taliban’s Afghanistan and here in Sweden.”

The Angel of Reason

Tanja Bergkvist – The Angel of Reason

But it’s in the academic community that feminism is the most influential and the consensus/conformity is the strongest. A rare example of someone rebelling against the insanity is Tanja Bergkvist, mathematician at the Royal Institute of Technology in Stockholm. In her blog she reports on gender politics that the mainstream media normally don’t care to mention for political reasons. It’s unfortunately only in Swedish but if you’re interested you might try and crunch it through a translator. Otherwise, here are a few goodies from her blog that will show that words like “madness” and “insanity” are in fact appropriate,

  • In 2007, the University of Lund (one of the most prestigious) decided to introduce so-called gender certification for every single course. Meaning a course in for instance theoretical physics should include information about the implications and relevance regarding gender issues on things like quantum theory. One criteria for certification was whether the department in question was actively seeking an equal distribution of male and female teachers. However, the department of gender issues at the university turned out to have 89 percent female teachers!
  • The government guidelines on gender education in pre-school include reading only modern stories to children and avoiding the classics or at least changing the gender of the characters. Cinderella would be a pretty gay dude – but all the better I guess.
  • In 2008, the gender committee of the Science Council, a government agency created to promote scientific research, begins a three year project on the gender aspects of the musical instrument of the trumpet. Here is a quote presenting the project and the important questions it will raise, “What timbre in the wide spectrum of the trumpet becomes the norm and what timbre is perceived as deviant and labeled female and male respectively?”
  • Also in 2008, the company Swedish Nuclear Waste Disposal that manages all the waste from Sweden’s nuclear power plants, hired two gender experts to include a text in the company’s yearbook entitled, “Gender constructions, perceptions on gender and the experience of risk – a reflection on the meaning of gender in regard to attitudes to long-term management of nuclear waste.”
  • In 2009, a gender expert holds a lecture at a seminar at the University of Uppsala (like Lund a top university) and notes that a man in the audience appears inattentive. She later finds out from a third person that he commented on the way she was dressed. So she files a complaint of sexual harassment. The university informs the man that they have started an investigation about his conduct. So he calls the woman to explain the reason why he had commented on her clothes. The woman forwards this information to the university as evidence of further harassment. The man is then questioned and admits to looking in his papers at times during the lecture and apologizes for commenting her clothes, but is nonetheless officially reprimanded by the university president.

This is just 5 out of 213 posts on Bergkvist’s blog and I have in no way cherry picked them; I just took a few of the earliest that were easy to understand for non-Swedes. You might think I’m making this up (or that she is) but see for yourselves, there are links to sources on all this madness. When this happens on the individual level it’s called a personality disorder, but what do you call it on the societal level?

And at the other side of the spectrum of Hofstede’s cultural dimension, Japan scores as the most masculine country in the world. A whole different brand of crazy…

 L1010853


A Little Speculation About Disgust Sensitivity and Attitudes Towards Homosexuals and People of Other Races

November 18, 2013

slob

What Is Disgust?

Disgust is an emotion and a corresponding aversive reaction that serves to protect us from disease and contamination. A clear indication of this is that we are the most disgusted by things and situations that may lead to contamination – infected wounds, feces, blood, rotten food (or rotten anything), people with bad hygiene, mice, fleas or other animals know to spread disease.

Since disgust has such an obvious function and is found in every known culture, as well as being expressed in exactly the same way in around the world, we have every reason to believe that it is an evolutionary trait. And as psychologist Jonathan Haidt and many before him have pointed out, disgust has likely evolved from a simple reaction to pathogens into a foundation for moral judgments – the filthy person isn’t just somebody who needs a shower. This wider range of disgust is shown in the additional dimensions of sexual and moral disgust in which the reaction isn’t primarily a protection against contamination but against other dangers having to do with survival and reproduction.

Correlates to Personality

In other words, disgust seems to be a wide personality trait, and like any other such trait it shows a great deal of individual variation. Research has found disgust to be linked to Neuroticism with a correlation around 0.45, which makes sense since it is an emotional reaction. Other than that it shows pretty modest correlations of around 0.3 to HEXACO Honesty-Humility. So there is a case for viewing disgust sensitivity as a fundamental personality factor along with Haidt’s other moral foundations. Which I suspect would be a great substitute for the Big Five, but that’s another story.

Correlates to Social Attitudes.

Psychologists theorize that disgust should be directed at strangers more than familiar people. This would be due to the fact that humans have lived in small groups that were likely to share diseases, pathogens and immunities. But members of outgroups could easily introduce completely new pathogens that the group had no protection against. If this is true, then people who score high on disgust sensitivity should also have a more negative attitude towards various outgroups. Research has shown this to be true: people who are easily disgusted have more negative attitudes towards for instance foreigners, disabled people and homosexuals. Disgust sensitivity has also been linked to various measures of political and religious conservatism. One study by psychologist John Terrizzi and colleagues at the Virginia Commonwealth University showed correlations in the range of 0.33-0.49 whereas measures of conservatism unrelated to the idea of contamination, like minimum wage and health care, showed negligible correlations.  At the same time, inducing disgust has also been shown to increase ingroup favouritism and outgroup hostility which suggests that a lot more than those who are easily disgusted can become hostile towards outgroups under circumstances that promote disgust, such as an epidemic. Studies have also found a seemingly curious effect in that liberals have less prejudice against foreigners and homosexuals when being primed with disgust before their judgments. But as X points out, this is most likely because they view these categories of people as part of their ingroup. So they essentially show the same pattern as conservatives. How they react to their own outgroups has yet to be examined.

The Effect of the Climate

If we take the example of a negative attitude towards homosexuals, hobby-psychiatrically referred to as homophobia, the most common theories on the origin of this attitude are about being gay and repressing it with anger or being scared of others thinking you’re gay and demonstratively objecting to it in order to divert suspicions. It’s very easy to see how these theories are problematic. If being gay would explain even half of the cases of homophobia it would mean that roughly half of the population in many countries in the Arab world must be gay. It would also mean that the number of gay people in for instance Eastern Europe must have increased dramatically for the change in attitude seen there in recent years to make sense. If it was about fear then why are there substantial minorities of homophobes in the most liberal countries like Canada or Holland, where no one gives a damn if you’re gay or not?

Clearly the case for disgust sensitivity appears much stronger. This could also provide an explanation for why some countries are more homophobic than others. If we look at maps of the prevalence of infectious diseases it seems clear that the most cases are found in Africa, the northern half of South America, the southern part of Central America, South- and South East Asia. In these countries there is a high population density that enables disease to spread more easily. It’s also warm, so vector organism can multiply more and aren’t forced to hibernate during winter. Here is a WHO map of combined infectious diseases,

Infectious diseases

Compare this to the PEW map of negative attitudes towards homosexuals,

PEW homosexuality

Or, for that matter, the World Value Survey map of racism,

racism

Sure, it’s no doubt more than one cause behind these attitudes. One likely candidate is clannishness/tribalism which is common in the Muslim world. This trait might explain some anomalies like the conspicuous French racism and the relative lack of homophobia in South America, although the difference between the northern and southern half of South America is striking nonetheless. Russia and Eastern Europe is also an anomaly but this can probably be explained at least in part by the collapse of the Soviet Union. During the communist era citizens were provided with free health care but after this system collapsed life expectancy rates have decreased sharply and infectious diseases like tuberculosis, HIV and even malaria have become more common. All in all, it seems pretty likely that some peoples who have originated in a warm climate would be more prone to outgroup hostility, or that the prevalence of infectious diseases could trigger such hostility.

So, Homophobia and Racism Is Ok Then?

Not exactly. Approving of behavior on the grounds that it’s human nature is absurd. Murder and rape is human nature too; it has been present in every known culture. Our attitude towards other people is always going to be at least partly about choice. If we want to fight these negative attitudes then knowledge is preferred to homespun theories. And knowledge, although still shaky, suggests that fighting racism and homophobia may be more about treating infectious diseases and stopping global warming then lecturing school children or having pride parades.

Of course, not all diseases are disgusting,


The Meth Hypothesis: Why Normal People Believe in Conspiracy Theories

October 9, 2013
You wake up one day and you're Steve Buscemi. Not worth it.

You wake up one day and you’re Steve Buscemi. Not worth it.

Is America losing it? It would seem so judging by polls on weird beliefs and opinions in recent years. Here is a recent handful from Public Policy Polling (PPP),

28% of voters believe that a secretive power elite with a globalist agenda is conspiring to eventually rule the world through an authoritarian world government

37% believe that global warming is a hoax/conspiracy

4% believe shape-shifting reptilian people control our world by taking on human form and gaining power. May not sound like much but that’s almost one in 20, so it’s very likely you know a person who is perhaps wondering whether you are one of the lizards.

9% believe the government is adding fluoride to the drinking water for sinister reasons.

21% believe a UFO crashed at Roswell in 1947.

15 % believe the media or the government adds secret mind-controlling technology to television broadcast signals.

It may of course be that Americans have always been crazy but that the media is reporting more of it than before to satisfy the public’s pressing need for entertainment – it seems most news sites have a “weird” section these days.  It’s hard to find any longitudinal data on conspiracy theories, but Gallup has data on odd beliefs, often held by the same individuals, from 1990 until 2005 and it suggests an increase. But why?

The Meth Hypothesis

We already know a category of people who hold both bizarre and persecutory beliefs – schizophrenics and schizotypal personalities. We also know that amphetamines will make a normal person start thinking like these people. Psychologists will even use amphetamine addicts to study schizophrenia and schizotypy for this reason.  Could this be what is causing this increase? There may be other factors contributing to the increase in weird beliefs – the rise of the internet, increasing marijuana use, globalization and diversity, fears regarding the environment etc. But only amphetamines are proven to produce odd and persecutory beliefs (the evidence for cannabis is much weaker). So let’s look at the stats. Since there doesn’t seem to be any official statistics on the overall number of meth users, I’ve chosen treatment admissions as a percentage of the population from SAMHSA as a proxy. These are all amphetamines but they all have a similar effect and meth is the most common.

treatment

Keep in mind that this chart is of treatment admissions rather than actual use. The peak in 2005 represents people who have been doing the drug for a while before understanding that they need help. The actual use of meth must have peaked earlier, exactly when is hard to tell but given how destructive this particular drug is, it’s probably not later than sometime around 2002-2003.

Witches, Hauntings and Aliens

Now compare this chart with some others showing how many Americans believe in various weird stuff (as a percentage of the population); the data is taken from Gallup. What we’re looking for is an increase during the 1990s and a peak a few years before 2005, in this case we have data for the year 2001 as the closest fit. So, here goes,

esp

This is not a great start, I’ll admit that. There is no gradual increase in the 1990s, but there is a small peak at 2001 and consequently a drop to 2005. This is also the belief that is the least odd with an average of 47 percent believers and 21 percent disbelievers.

possession

This data is even less kind to my meth hypothesis. It has none of the three features and with 42 percent believers and the same percent disbelievers it’s not that odd, although clearly polarizing with few uncertain. It’s possible that since this question was specifically about the devil it could be linked to religion in a way the others aren’t.

healing

Healing shows a gradual increase but that’s about it. Then again this is also one of the more conventional beliefs with 52 percent believers and only 29 percent disbelievers. So I wouldn’t count this one at all. A majority view is in no way odd.

telepathy

Telepathy is moderately odd with 34 percent believers and 39 percent disbelievers. It has no initial increase but it peaks in 2001.

hauntings

Hauntings is also moderately odd with an average of 34 percent believers and 40 percent disbelievers. This one has all the features, a gradual increase with a peak at 2001.

alien visitation

Alien visitation has 28 percent believers and 43 percent disbelievers so I’d consider it to be clearly odd. Although we only have data for three years, these do illustrate the features that support the hypothesis.

clairvoyance

Clairvoyance, here defined as the power of the mind to know the past and predict the future, has an average of 28 percent believers and 48 percent disbelievers, again a clearly odd belief. And it shows an increase during the 1990s, and a peak at 2001.

Astrology

A little surprising, astrology counts as clearly odd belief with a ratio of 25/55 believers and disbelievers. It has most of the 1990s increase but beginning with a drop, then peaks at 2001.

ghosts

With 31 and 51 percent believers and disbelievers this is also a clearly odd belief. And it has all the right features.

reincarnation

At 23/51 believers and non-believers, reincarnation is also clearly odd. It has the year 1994 that ruins the initial increase but it shows an increase from 1990 to 2001 so overall there is an increase, followed by a local peak at 2001. 4 out 5 years confirm the hypothesis.

communicating with the dead

Also a clearly odd belief (23/54), with same flaw that the previous chart had – all years except 1994 confirms the hypothesis. The peak in 2001 is of the same magnitude as that of 1994.

Witches

This is my personal favourite. It’s what I’d call a very odd  belief with only 19 percent believers and 69 percent disbelievers. Witches are also malicious agents that plot against people, making this belief very similar in nature to conspiracy theories. The chart has all the right features.

channeling

Finally, channelling, the ability that some have to go into a trance and let spirits talk through them. This is also a very odd belief (9/66) that fits the meth data perfectly.

Summing Up the Evidence

Which of these beliefs should be considered sufficiently odd? We can certainly not say that spiritual healing is an odd belief since it is held by a small majority. As for the rest, it’s admittedly a bit arbitrary but, I would define a belief as odd if it has fewer believers than disbelievers, which seem like a minimum requirement. This means that healing, possession and ESP are out, leaving us with 10 odd beliefs. So how well did these 10 confirm the meth hypothesis?

7 out 10 showed an absolute peak at 2001. Of the rest telepathy and communicating with the dead showed shared a maximum peak at 2001 with another year. The remaining belief in reincarnation showed local peak at 2001. That’s pretty peaky.

As for a continuous increase in the 1990s there are three categories: 5 had unequivocal increase throughout the 1990s, 4 had overall increase from earliest year to 2001 but interrupted with a local decrease (for hauntings this decrease was very small), and one, telepathy, had the same value for 1990 and 2001. No overall decrease at all.

So the data seem to support the hypothesis pretty well. But there are of course other possible factors to consider,

Alternative Explanations

As I said earlier, marijuana is sometimes mentioned as a drug that could contribute to schizotypal and outright schizophrenic thoughts and beliefs. But unlike meth, this drug has increased continuously since the early 1990s and has still to peak. Another candidate is the internet. I’m not going to do a chart for it but the number of internet users is constantly growing so no peak there either. Yet another candidate could be changing demographics. Perhaps the Catholic immigrants to America bring their superstitions with them? But looking at Mexicans, the overwhelmingly largest Hispanic group, there is no peak, not even a local, in their part of the population, only a continuous increase over the years.­

How Can This Be?

But how does this happen? How does such a small group – according to most estimates just a few hundred thousand –  of people have such influence?  One reason is that a person holding an irrational belief is usually more interested in it than say a regular Christian is about transubstantiation. They will obsess about it constantly. Like former meth user Fergy Duhamel of the Black Eyed Peas says in an interview,

I had about 20 different conspiracy theories. I painted the windows in my apartment black so they couldn’t see in.

When a schizophrenic on the sidewalk rants about the government this doesn’t persuade anyone, but a more coherent and presentable schizotypal person can be appear much more convincing. And my guess is that a meth user online can probably do a pretty good job at selling his theories too – especially when other meth users are online on various forums saying similar things. While what they are saying may not make much sense it doesn’t have to. Just saying it repeatedly and with great conviction goes a long way. One thing social psychology (it’s not all bad) teaches us is that repetition is an effective way of persuasion, especially if you vary the way you say it a little – which is exactly what you get from an army of delusional meth addicts sitting up all night preaching their peculiar gospel.

But can they really sit still while on meth? It seems so. Because not all meth addicts are out partying or committing crimes. Some stay indoors cooked up in their houses or apartments. In an article in The Kernel, science writer Greg Stevens shares his experiences of some middle class meth addicts. One of them is “J”,

The window shades are drawn tight because J usually stays awake for 70 to 100 hours at a time. He knows that if the neighbours can see light coming from his house at all hours of the night, they will begin to suspect something. J has also placed a folding room divider covered with tinfoil in the hallway just inside the front door. This is to block any kind of infra-red or other types of electromagnetic spying equipment that the neighbours might be using.

It’s not hard to imagine how an intelligent, educated and hermit-like person like J combined with 20 conspiracy theories like Fergie would make an ideal person for spreading these ideas over the internet. If we guesstimate that there are 300K meth users in America and ten percent of them rant about conspiracies online, then that would be roughly twice as many as there are lobbyists in Washington. And they are no doubt much more persistent.


The IQ Breaking Point – How Civilized Society is Maintained or Lost

September 24, 2013
West Virgina at IQ 96. Life just below the breaking point.

West Virgina at IQ 96. Life just below the breaking point.

It’s a well-known fact that intelligence corresponds to various kinds of life outcomes at the individual level, such as income, education, drug abuse, criminality etc. A little less known is the fact that national average IQs correspond to similar outcomes on the national level. This has been shown by among others psychologists Richard Lynn and Tatu Vanhanen, who have found staggering correlations between national IQ and things like health, education, income, crime, corruption, democracy.  To give you a rough idea, here are some of the findings,

Educational measures like TIMSS and PISA correlate 0.79-0.92

Number of scientists and engineers correlate 0.61

Measures of  per capita national income (GDP, GNP, GNI) correlate 0.51-0.89

Poverty and unemployment: -0.63 and -0.76 respectively

Crime in the form of homicide, assault and rape: -0.21 to -0.82 with distinctly higher correlations for the more accurate measure of homicide

Corruption: -0.27 to -0.68, all but one study above -0.54

Democracy: 20 of 22 measures show correlations around 0.60

Life expectancy: 0.51-0.82, expect for one study that found a negative correlation (possibly a typo)

Anyway, you get the picture. All the basic requirements for modern civilization – democracy, education, wealth, health and (lack of) crime and corruption – are strongly related to national IQs.

IQ 97: The Breaking Point

Seeing these correlations, it’s easy to assume that national IQ averages would correspond to specific degrees of development – that South Korea with an IQ of 107 would be much more civilized than Australia at 98, which in turn would be fairly similar to Russia or some other country at 97. But looking at the stats this is far from the case. Instead it seems like there is a point, somewhere around 97, above which a modern civilization can be maintained and below which things abruptly begin to fall apart. To illustrate this I’ll review some of the correlations mentioned above.

GDP (PPP) Per Capita

You can’t have civilization without money. It pays for education, healthcare, police etc. If we use the national IQs from Photius.com, who appear to have the updated version of Lynn and Vanhanen’s data set (correct me if I’m wrong), and compare them with the GDP/PPP that takes local purchase power into account, we find clear support for the idea of a breaking point at 97 or thereabout. If we exclude oil nations, the top 20 with populations over one million, according to Wikipedia/IMF are,

Singapore, Hong Kong, USA, Switzerland, Canada, Australia, Austria, Netherlands, Ireland, Sweden, Germany, Taiwan, Belgium, Denmark, UK, Finland, Japan, France, Israel and South Korea.

In these top 20, there are nine nations in the 98-99 range, but only two countries below 98 – Israel and Ireland. Both can be partly explained by the fact that they receive plenty of financial aid from USA and the EU respectively. And it’s unlikely that Ireland will stay in the top 20 given its huge public debt and very high unemployment.

And if we look at more “normal” countries with IQs below 98, those without oil or rich friends, we find Slovenia with an IQ of 96 at 24th place, then Cyprus with an IQ of 91 at 26th, and Greece with an IQ of 92 at 27th. And Greece may well have lost this spot as I write this. So at 98 there are plenty of wealthy countries, but at 97 it suddenly seems to evaporate. And this isn’t just about money; if we turn to corruption we find a very similar picture.

Corruption

According to the Corruptions Perceptions Index (CPI), the top 20 countries (again with a population of over one million) most free of corruption are,

Denmark, Finland, New Zealand, Sweden, Singapore, Switzerland, Australia, Norway, Canada, Netherlands, Germany, Hong Kong, Belgium, Japan, UK, US, Chile, Uruguay, France, Austria and Ireland.

Strictly speaking this is 21 nations since Austria and Ireland share the 20th spot and it seemed a bit random to exclude the one or the other. Anyway, we find 10 countries in the 98-99 range – including the top 4 and 6 in the top 10. The only three countries below 98 are Ireland (see above), Chile with an IQ of 90 and Uruguay with an IQ of 96. Again we see how everything is fine at 98, but at 97 and below things go south.

Crime

Turning to crime, so to speak, we find the top 20 countries with the lowest homicide rates (and more than one million inhabitants) according to Wikipedia/UNODC are,

Singapore, Hong Kong, Japan, Bahrain, Norway, Austria, Oman, Slovenia, Switzerland, United Arab Emirates, Spain, Germany, Qatar, Denmark, Italy, New Zealand, China, Saudi Arabia, Sweden, Australia.

This clearly breaks the pattern since we have five nations in the 98-99 range and just as many low-IQ nations, all from the Arab world. However, if we are looking for a point at which modern civilization begins to crumble, then we shouldn’t look at dictatorships at all. They can keep the murder rate low with social control and oppression, but at in doing so they disqualify themselves as candidates for civilized societies. So if we limit our sample to at least somewhat civilized countries we get a different picture. This is of course a rather subjective method but I think we can all agree that the countries above can’t be a part of it. I have included Hong Kong but excluded China so that’s where I draw the admittedly somewhat arbitrary line. The top 20 at least moderately civilized countries with the lowest homicide rates then become,

Singapore, Hong Kong, Japan, Norway, Austria, Slovenia, Switzerland, Spain, Germany, Denmark, Italy, New Zealand, Sweden, Australia, Poland, France, Netherlands, Ireland, UK, Portugal and Serbia (IQ 89).

Again, this became 21 countries because the two last share the 20th place. We find nine nations in the range 98-99 and four countries below that. The anomaly here is Slovenia at 6th place, a country that was also a mild anomaly with 24th on the GDP per capita list. But overall, this confirms the previous findings in that there are plenty nations in the 98-99 range but at 97 or less they are few and nowhere near the top of the list.

Indeed looking at where the sub-98 countries are on these lists we find that they made places 9 and 18 on the GDP list; 17, 18 and 20 on the corruption list and 6, 18, 20, 20 on the homicide list. So they are not only few but mainly at the bottom.

Democracy

Finally, let’s have a look at the Economist Democracy Index for 2012. The top 20 nations with more than a million people are as follows,

Norway, Sweden, Denmark, New Zealand, Australia, Switzerland, Canada, Finland, Netherlands, Austria, Ireland, Germany, UK, Czech Republic, Uruguay, Mauritius, South Korea, USA, Costa Rica and Japan.

As you might expect by now, around half of these, nine, are in the 98-99 range whereas only four are below that. Again, Ireland is breaking the pattern, as are Uruguay, Mauritius and Costa Rica with IQs of 90 and 89 respectively. We also find that four of the top five have 98 IQs whereas those below this level are at 11, 15, 16 and 19.

An Index of Civilization

So what happens if we add these measures up? I did this by scoring point in reversed rank order starting from 100 for each measure to create an civilization index. A statistician can probably come up with something better, but it will give a rough idea of the overall picture. The chart below shows the result,

Civilization2

As expected, there is a general pattern of higher degrees of civilization as intelligence increases. But the most civilized countries are all in a cluster with IQs between 98 and 101. Below 98 the level drops dramatically as can be seen by the lack of dots in the upper left part of the chart. The only distinct anomaly left is Ireland which scores 360 points for the 12th spot and, less striking, Slovenia at 20th with 335. Or, given what I’ve mentioned about the Irish economy, it may be Slovenia that is the more genuine anomaly here – clearly not as horrible as it’s portrayed in the Hostel movies. At any rate, combining these factors eliminates anomalies and further strengthens the support for an idea of a breaking point at approximately 97.

America

I haven’t found any official statistics for state-level IQs in America. There are however some estimates made by the Audacious Epigone, based on the NAEP scores, and educational measures are strongly correlated with IQs. He has also set the American average at 98 which matches the figures I’ve used above. If we exclude District of Columbia, which is common in these cases since it’s full of government money and temporary inhabitants, the top 20 GDP per capita (I haven’t found any PPP numbers), are as follows,

Delaware, Alaska, Connecticut, Wyoming, Massachusetts, New York, New Jersey, Virginia, Washington, Colorado, California, Maryland, Minnesota, Illinois, South Dakota, Nebraska, Hawaii, Iowa, North Dakota and Louisiana.

As in all the previous calculations, we find that states in the 98-99 make up roughly half of the sample, once more dominating the top positions – 1, 2, 4, 6, 8. Below this level we find only three states, California with an IQ of 95 at 11th position and Hawaii with an IQ of 96 at 17th and Louisiana with an IQ of 96 at 20th place. There may be some explanations for these anomalies although I’m not that familiar with American politics. But it seems clear that California is in at least as much trouble as Ireland.

Conclusions and Implications

I’m not going to say that every conceivable measure on every conceivable level will show this pattern, but overall I think we have to conclude the existence of an IQ breaking point somewhere close to 97, at which we see drastically different outcomes depending on whether a country is above or below this level. A country can of course still fail above this point, like Italy and most likely North Korea. But a national IQ above 97 represent a necessary, but not sufficient, condition for success.

One implication, if this turns out to be true, is that immigration could pose a serious threat to the West, especially those countries and regions that are closest to the breaking point. The sad part is that since everything is going so well at 98 they may dismiss this risk. This is especially true for those countries and states who are right at 98 and whose immigrants have the lowest IQs, for instance France or Texas. As for California that state has now clearly passed the breaking point, it will be interesting to see if they will break the pattern. I suspect they won’t, given that the few countries that do fairly well below 98 (Ireland, Slovenia, Uruguay etc) are all small and lacking in diversity, which is the opposite of California.

It’s fully possible that someone else already has noted this breaking point, but since I hadn’t heard of it before and it didn’t seem like common knowledge, I figured it was worth sharing. I have no idea why 97 would be a magic number; maybe it’s just something in the human condition. I’ll be updating this article whenever I find any relevant information on this.


The Death of Enlightenment – or How Nebraska Beats California

July 14, 2013
Children of the Corn. Now that's a tightly knit community.

Children of the Corn. Now that’s a tightly knit community.

So I’ve had this ongoing discussion with the eloquent liberal blogger Santi about the state of California. We both agree that this state embodies the ideas and the spirit of Enlightenment, being liberal, tolerant, open-minded, diverse, metropolitan and so on. All good qualities that will translate to a happy and prosperous society, he claims.

To me, however, being more of a social conservative (but still open to new ideas) these qualities are more problematic. Naturally I admire the original men of Enlightenment for trying to bring some rationality and justice into the Western societies of the 1700s, but today I think this movement or trend has degenerated into destructive and irrational project. It’s all good to have a little diversity and mutual respect for each other’s differences, but at the end of the day societies are based on what we have in common – not on what sets us apart. So there has to be a limit to our tolerance. Experience tells us that the fabric of society, the things that bind people together, is blood, history, religion, traditions and the values that come out of this mix. Friends of Enlightenment dismiss this idea and claim that all we need is to agree on some house rules, and then everyone can do their own thing while respecting each other. And so the discussion goes.

But instead of discussing, I thought it would be interesting to do a match-up between Team Enlightenment, in the form of California, with Team Tradition, in the form of a state that in as many ways as possible is the opposite of California. Using the description above as criteria, I settled for Nebraska. It’s a solidly red state with more people identifying as conservative than in most states. It has very little diversity being 86 percent White (82 percent non-Hispanic White). It’s one of the most religious states and Christianity is practically the only religion. It is rural and has no metropolitan areas. Nebraska also differ sharply from California in terms of personality, judging by data compiled by psychologist Peter Rentfrow – Californians are more introverted and open to experience while Nebraskans are more extraverted, agreeable and conscientious. (The two states score about equal on Neuroticism.) So are these hicks any match for California? Let’s start by looking at some basic economic factors and then on to general well-being, crime and corruption etc. To get some general perspective I’ve also added the national average on these metrics.

Economy

First off, here is the per capita income in thousands of dollar for the time period 1990-2011 (sorry about the x-axis; my chart skills are limited), data taken from the Bureau of Business and Economic Research at the University of New Mexico,

per capita income

As we can see, California is staying on top for the entire period, but since incomes have roughly doubled during this time the relative differences are actually shrinking. To get a better idea of what is going on, I made a chart showing per capita income of Nebraska and the nation as percentages of Californian income for the same time period,

per capita percentages

Here we can see more clearly how national per capita income has been gaining on the Californian ditto, and even more so for Nebraska which has gone from 84 percent to 97 percent. That’s a very small advantage left for California and one that’s clearly diminishing in the long run. With that in mind, look at the next chart showing economic inequality,

Gini coefficient

The chart is showing the Gini coefficient, a measure of economic inequality (the higher the more unequal), data taken from Wikipedia/US Census Bureau 2010. This is probably counter-intuitive to many people – the Republican Nebraska seems to be spreading the wealth way more than progressive California. I’m not exactly sure why this is, but more stats will confirm this picture. Such as for instance poverty rates,

Poverty

Here is the poverty rate for 2011 as a percentage of the population according to US Census Bureau. Almost one in four Californians are poor. That’s the highest rate of all states and more than twice that of Nebraska. Again we see that Nebraska is spreading the wealth somehow whereas California is not. We find a very similar picture if we look at unemployment, here the percentage rates for May 2013 according the Bureau of Labor Statistics,

unemployment

And if you think that is just a fluctuation and that California with all its creative people are busy generating jobs for the future, here is Gallup’s Job Creation Index for 2012,

job creation index

Evidently, Nebraska is much better at creating new jobs which explains the low unemployment, and probably also why the state has almost caught up with the Californian per capita income and looks to surpass it in the near future.

Health and Well-Being

Still, money isn’t everything. Perhaps the diversity and sunny weather makes for a happier and healthier life? Here is Gallup’s Well-Being Index for 2012,

well-being

Overall Nebraska scores higher although in fairness, looking at some of the sub-factors, Californians eat more fruit and vegetables, exercise more and have less obesity. But Nebraska still wins this round with more people with health insurance, more people who feel their neighbourhood is getting better and fewer people having diabetes – somehow those healthy Californians are still getting more diabetes – a matter of stress or genetic differences?

Crime and Corruption

Moving on to crime. I’ve chosen murder because it’s perhaps the most robust measure in this field (although using total crime will give a similar pattern). Here is the murder rate per 100K inhabitants in 2009 according to US Census Bureau,

murder rate

As you can see, the Californian murder rate is only slightly higher than the national average, but it is more than twice that of Nebraska.

As far as corruption goes the states are fairly similar: California is ranked 81 and Nebraska 80 on the State Integrity Investigation’s ranking for 2012, a negligible difference, but this index shows some weird fluctuations that are not present in the international Corruptions Perceptions Index. For this reason I’ve used actual convictions instead, compiled by the Justice Department and visualized in an interactive map at governing.com. Here are the convictions between 2000-2010 per 10K public employees by state,

convictions

California is clearly better than the national average but is again beaten by Nebraska, having almost twice as many convictions.

Education

Like State Integrity Investigation’s ranking, there are some subjective measures of the quality of education, so I’ve focused on actual attainments in the form of NAEP scores and statistics on degrees from the US Census Bureau. Here is the current situation in terms of achieved degrees,

degrees

California has a little edge when it comes to higher education but not much. The most conspicuous difference is how Nebraska has distinctly less people without a high school degree, something that fits well with the low poverty rate.

And for a look at what the future may hold, here are the NAEP scores for 8th graders in 2011,

naep

They look similar but California is below the national average in all categories whereas Nebraska is equal to the national average on math and slightly above on reading and science. And this of course means that Nebraska wins over California in all categories. The reason is most found in the changing demographics; the Californian population is now largely Mexican and Mexico has a national average IQ of 85 or thereabout.

The Verdict

I may be engaging in confirmation bias here, seeing what I want to see, but judging by these metrics, had this been a boxing match then California would have been lying on the floor by now. California has historically attracted smart people and Silicon Valley is still the high-tech hub of the nation. But per capita income is the only metric in which California clearly beats Nebraska. And that is likely to change as Nebraska now has 97 percent of the Californian income and has smarter school children.

So why is Team Tradition winning over Team Enlightenment? I believe it’s because Team Tradition is built on common denominators – ethnic, religious and historical. That creates trust, loyalty and friendship – and that translates to less crime, and probably less poverty too as people know each other and become more inclined to help one another. It also creates more well-being (less stress and insecurity) and more efficient ways of doing business. It probably leads to more corruption sometimes, when people get a bit too friendly, but judging by this example that isn’t always the outcome.

Meanwhile, the only thing members of Team Enlightenment have in common is the idea that they don’t need to have anything in common other than a set of rules. This creates a team of strangers who have no good reason to be loyal, friendly or trusting of each other. It’s a team who will settle all their conflicts in court – or with a gun – and who will welcome any new members regardless of their qualifications or abilities. How can that team ever win?


Human Biodiversity – Things You Are Not Supposed to Know About

June 5, 2013

As someone interested in personality, I find the field known as Human Biodiversity (HBD) to be fascinating. For those who are unfamiliar with it, HBD is a field in which controversial issues regarding human nature are explored, debated, and above all, brought out into the open. HBD is about things ordinary scientists and journalist would prefer you didn’t know about. Plausible but suppressed facts and theories on things like how inbreeding has turned people in the Muslim world more “tribal” than others, resulting in corruption and violence and low national IQs. Or how homosexuality actually has a very low heritability and may be caused by a pathogen. Or how low intelligence may be a greater health problem than overweight, how ethnic groups may differ in behavior for genetic reasons and how this affects society. And so on.

Often discounted as amateurs, racists, sexists etc, HBDers are a mixed bunch of people who pursue these issues with little or no funds at their disposal. They are rarely prominent experts in their fields – because that would no doubt get them fired – but they have plenty of education and intelligence, and I think any honest person who listens to what they have to say will have to agree that they offer more than just shock value. Human nature includes our dark and problematic sides too. A true scientist delves into that as well, because he holds the truth above all other considerations. In that sense HBD is more science than a lot of what passes as science in Academia.

There is no official introduction to HBD as yet, but as a next best thing you can read Jayman’s 100th post  published today, which offers a well-written overview of the field.


The Ugly Truth About Obesity

May 30, 2013
A victim of prejudice?

A victim of prejudice?

Obesity, defined as having a BMI over 30, is increasingly common these days. In America 30 percent of the population is obese while many other Western countries have similar figures (no pun intended). When obesity is debated it’s usually about health issues, but there is also another aspect to consider, namely that of obesity bias and discrimination.  According to Obesity Society, obese people are often viewed as “lazy, sloppy, less competent, lacking in self-discipline, disagreeable, less conscientious, and poor role models” as well as “unintelligent, unsuccessful, weak-willed, unpleasant, overindulgent”.

This negative view leads to discrimination in for instance employment and college admissions. In the medical setting, the negative attitude towards the obese may also lead to patients cancelling appointments, with worse health as a consequence. According to a study from Yale University, self-reported weight discrimination is as common as racial discrimination.  This may seem especially problematic since the obese are not protected by any minority laws so in many cases discrimination is perfectly legal.

On the other hand, what if all these negative stereotypes are accurate? After all, many stereotypes have some truth to them – Jews do make more money than others; Black people are more often involved in crime; there is plenty of research to show that East Asians are more introverted than other people. So why can’t stereotypes about the obese be accurate?

Like most things, this has been researched. Intelligence shows a very clear connection to IQ, as illustrated here. And since intelligence is linked to work performance this suggests that the obese may be unsuccessful and less competent as well. This in turn may explain the “wage penalty” that the obese suffer – like all groups with low intelligence do.

As for the personality traits mentioned above, Angelina Sutin and colleagues at the National Institute on Aging, National Institutes of Health, and the Department of Health and Human Services, have conducted perhaps the ultimate study on this, using some 2000 participants, spanning over 50 years and applying 14 500 measurements of weight. And they didn’t just content themselves with the Big Five personality factors but looked at all the subscales. They found that weight gain was most clearly related to Impulsiveness (a facet of Neuroticism), Warmth, Assertiveness, Positive Emotions (all facets of Extraversion), and a lack of Order and Self-Discipline (facets of Conscientiousness). It’s also interesting to note that while strongest predictor, Impulsiveness, as mentioned a facet of Neuroticism in the Big Five model, none of the other facets of this factor – Anxiety, Depression etc, related to overweight. So they common idea of the emotional overeater seems to lack empirical support.

So yes, the obese group is not unlike its negative stereotypes. Of the, “lazy”, “sloppy”, “less competent”, “lacking in self-discipline”, “disagreeable”, “less conscientious”, “poor role models”,” unintelligent”, “unsuccessful”, “weak-willed”, “unpleasant”, “overindulgent”, it seems “disagreeable” and “unpleasant” are the only clear misses.

This is not to hate on the obese, but to call a spade a spade. The idea that the problems of the obese are outside themselves is an unhealthy illusion here examplified by Slate Magazine’s Daniel Engber,

Stop hating. If we weren’t such unrepentant body bigots, fat people might earn more money, stay in school, and receive better medical care in hospitals and doctor’s offices. All that would go a long way toward mitigating the health effects of excess weight—and its putative costs

This under the false assumption that fat people have the same intelligence and Self-Discipline and that the reason they cancel appointments is not due to Impulsiveness and lack of Conscientiousness but only because of other peoples prejudice. In doing so, he enables fat people to stay fat and to blame society for their problems, and to, like the Obesity Society, view the condition as unrelated to willpower.

The harsh truth is that the obese are in a lot of trouble. They are less attractive in the workplace because of their combination of intelligence (or lack thereof) and personality. Work performance is best predicted by IQ scores and next best of Conscientiousness. Impulsive behavior on the other hand predicts crime and accidents. Most employers are probably not aware of the research linking obese people to these characteristics and outcomes, but they know from experience that employing an obese person is a financial risk with no apparent reward.

They should of course look at the individual, but not everyone can afford testing every potential employee. Nor can a doctor test his patients. But he can use his experience, which tells him that the obese person is much less likely to follow his professional advice. And even if they could check every individual it wouldn’t solve the problem because the reason the group has these characteristics is because so many individuals belonging to the group have them.

So, is there any way to help this group? My guess is that the best solution would be to introduce vice taxes and similar paternalistic measures. You can’t leave someone who is out of control to their own devices. The worst solution is the one used right now – blaming negative stereotypes and discrimination, when scientific research validates those exact stereotypes as well as provides perfectly rational reasons for discrimination.


Why Intelligent People Are Healthier

November 29, 2012

“If you ask what is the single most important key to longevity, I would have to say it is avoiding worry, stress and tension. And if you didn’t ask me, I’d still have to say it.” George Burns (1896-1996)

The studies on intelligence and longevity all agree that those with high IQs live longer. One of these studies, the Swedish Conscript Study, is especially impressive since it includes practically all Swedish men born between 1950 and 1976 – making the number of participants just under one million. They all took an intelligence test which uses a nine grade scale. Those scoring 9 were 20 years later shown to have a 70 percent less risk of mortality than those scoring a 1.

This may sound like something obvious – people with high intelligence come from better homes and have been brought up by parents who give them more fruit and vegetables and less pizza and soft drinks. However, it was shown that adjusting for things like parental socioeconomic status as well as blood pressure, weight, physical illness at conscription, the risk of mortality for those with the highest intelligence was still reduced by 60 percent compared to those with the lowest intelligence. This is really worth noticing – social background makes up less than 10 percent of the reduced risk of mortality. This is partly explained by the fact that the men were in their 40s at the follow-up, and few die from cardiovascular disease at that age. But it’s still interesting to note that social background is such a little factor in overall mortality.

So while it’s known that intelligent people engage in health behaviors – eating vegetables, exercising, following the doctor’s orders when ill. It’s reasonable to suspect that a healthy lifestyle is the mediator between IQ and longevity, even though this lifestyle is probably more a matter of personal decision than upbringing. It accords well with the connection between IQ and death in cardiovascular disease, the biggest killer. But if we look at cancer, the second biggest killer, the connection with intelligence is weak or non-existent. For skin cancer it’s even inversed. How can that be?

I haven’t found any explanation for this paradox in the literature, but looking at the causes of these two killers it’s clear that cardiovascular disease is related to stress in a way that cancer is not. And stress is a lot about lack of control. It’s a well-known fact that those prone to stress, that is those having the trait neuroticism, have more heart disease. This idea is supported by another large study, called the Vietnam Experience Study, which looked at mortality of veterans and found that the more neurotic a veteran was the more a high intelligence would lower his mortality.

This suggests that a major part of why intelligence promotes health is in that it protects against the harmful effects of stress and thus against cardiovascular disease. How? It could be that they use their intelligence to cope with stressful events better. It may also be a matter of what some researchers call system integrity. A high intelligence, according to this theory, is an indication of a  generally more robust and well built organism that doesn’t break under pressure as easily as the average. Although this has been hard to prove some studies have found that reaction time, as a proxy for system integrity, account for most of the correlation between intelligence and mortality. It could of course also be a combination of stress handling ability and system integrity.

All of these interesting findings are found in the relatively new field of cognitive epidemiology. While it doesn’t disprove that eating lots of vegetables is good for you (it really is) it shows that this may be of less importance than most of us imagine compared to stress – our proneness to it in form of neuroticism, but perhaps even more important how we cope with it, both psychologically and in terms of biological hardiness.


72 Is Not Going to Be the New 30 for Honey Boo Boo – A Few Thoughts on National Character, Health, and Longevity

October 22, 2012

30 might just feel little bit like 72 for this girl…

Under the headline “Modern humans found to be fittest ever at survival, by far” Los Angeles Times recently featured an article about a study from the Max Planck Institute for Demographic Research, on the increase in life expectancy,

A typical Swede, for instance, is more than 100 times more likely to survive to the age 15 than a typical hunter-gatherer. And a hunter-gatherer who has reached the ripe old age of 30 is about as likely to die in the following year as the world’s champion of longevity — a 72-year-old woman in Japan.

But are Swedes and the Japanese really representative of all modern humans, or even of populations in the developed countries? I think it’s safe to say that these two people are known to have certain traits, national characters, that set them apart. Hardly anyone would argue with the claim that they are less impulsive than the average.

Research on national characters – the specific collective personality traits that distinguish on nationality from another – has proven difficult. A large study by Terracciano back in 2005 found that the national characters don’t accord with mean levels of personality traits. So is this idea just in our heads, that say the Chinese are more introverted than Americans?

Most likely not, since all research into stereotypes so far tends to find a kernel of truth in them – Jews as a group make more money, African Americans as a group are more violent etc. But personality research is almost exclusively done with self-report questionnaires. When people answer question about their own personality they relate it to other people in their own country. This means that differences between countries can be due to other factors like how socially desirable a trait is in that country or how prone a certain people are to self-enhancement, portraying themselves as better than they are. Studies have found that East Asians are not as prone to this as Westerners which could explain why Americans for instance measure higher than the Japanese on conscientiousness.

Some psychologists have tried to get around this problem by looking at how personality traits are expressed in different cultures, or to use ethos in the form of institutions that embody ideals that are typical of certain traits. But that’s all very problematic since it involves measuring the same thing in different and indirect ways.

A better way to do this (which at least I haven’t read about) is to measure actual behavior related to personality traits. Because there are traits that have universal behavioral outcomes.  Take impulsivity for instance. This trait predicts drug abuse, violent crime, traffic accidents etc in all parts of the developed world.  So if these outcomes differ according to stereotypical notions of national characters then we have some evidence that these do reflect actual personality differences between nations.

Since I haven’t come across any such research I decided to dabble a little myself, just to see if there might be anything to this. I took two measures – adult lifetime use of cannabis, and road fatalities – and combined them into a composite measure of impulsivity. The countries included are mainly those commonly thought of as impulsive, New Zealand, USA, Australia, and Denmark. I contrasted these against the two nationalities mentioned in the article, those of Sweden and Japan. So here is what I found.

Adult lifetime use of cannabis according to Wikipedia/EMCDDA: Stereotypically impulsive nations like USA 42.4 percent, New Zealand 41.9 percent , Denmark 36.5 percent, and Australia 33.5 percent. As a contrast Sweden has 12 percent and Japan a mere 1.5 percent.

Road fatalities per 100K inhabitants and year according to Wikipedia/WHO: Again looking at the stereotypically impulsive nations we have, Australia 5.7, New Zealand 8.6, USA  12.3,  Denmark 7.4,  whereas Sweden has 2.9 and Japan 3.85.

If we combine these percentages to a composite measure of impulsivity by adjusting so both measures have the same average, we find the following order with life expectancy in the second column,

USA                       50           78.2

Australia               56           81.2

New Zealand        77           80.2

Denmark               67           78.3

Sweden                 24           80.9

Japan                    17           82.7

This gives us a clear indication that nations thought of as impulsive actually have more outcomes that are known to correlate with impulsivity on the individual level. Their average level is 62.5, which is 3 times the average of Japan and Sweden combined. It’s especially striking to see the big difference between the neighbors  Denmark and Sweden that are very similar in many other ways.  And this measure of impulsivity also correlates  -0.6 to life expectancy which is quite respectable.

…but not for this one.

Although it’s not a scientific study, I believe this little exercise clearly raises the question of whether any developed country can be taken as a measure of how technological progress translates to longer life expectancies in general. It suggest that this is not the case, and that differences in personality traits between countries, often referred to as national characters are in fact real, and affect health and longevity in the same way as they do on the individual level.