Personality Regions: The Friendly Midwest, the Left Coast and the Wicked (Possibly Irish) Witch of the Northeast

March 18, 2014

I find the geographic distribution of personality traits to be a very interesting topic. It can give us insights on so many things, like human evolution, culture, politics etc. As I blogged about before here, psychologist Peter Rentfrow has noted that America is split in two halves that score high and low in neuroticism. And German psychologist Martin Obschonka has identified a personality profile that is more common in the region called the Mountain States or Interior West that correlates with entrepreneurial activity. Last year, Rentfrow  dug deeper into this with an interesting study which didn’t get as much attention as it deserved, so here is a little something to correct that mistake. The study combines large samples of Big Five test data (a total sample size of almost 1.6 million) and use so-called cluster analysis to identify psychological regions within America. To get a bird’s eye view of his findings, let’s start by showing some maps of the regions in question,

cluster 1

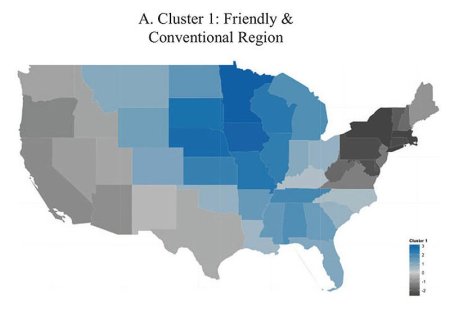
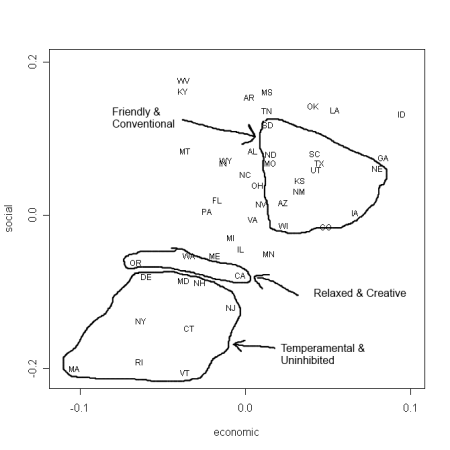
The “friendly and conventional” (FC) region in the middle and southern part of the country is characterized as being more extraverted, agreeable and conscientious, a little more emotionally stable (low neuroticism), but also much less open to experience than the national average.

cluster 2

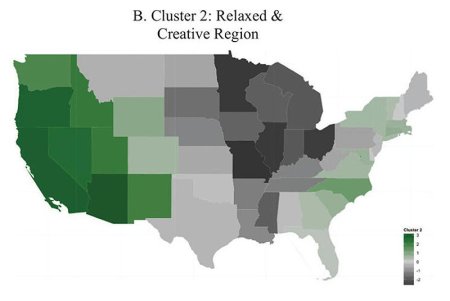
The “relaxed and creative” (RC) region in the western part of the country is characterized above all by being very open to experience and emotionally stable, but also introverted and slightly less agreeable than the average.

cluster 3

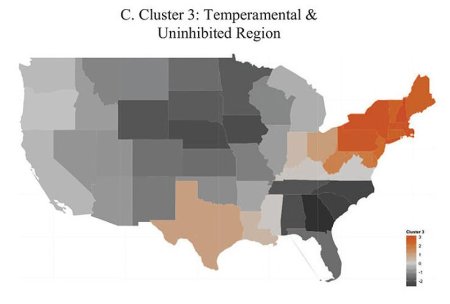
And finally, the third region, “temperamental and uninhibited” (TU), located in the northeastern part of the country, from Maine down to West Virginia, is characterized as very emotionally unstable and low in conscientiousness while being moderately introverted and open to experience. I wonder if that’s how they describe themselves on dating sites : )

I think most people can recognize that these differences exist to some degree. I’ve never been to America myself, but a friend of mine was there on a business trip and he noted how friendly and pleasant the Midwesterners were. But when he mentioned that he was heading to California they shook their heads and one of them said, “you won’t like it, it’s all Mickey Mouse.” But how much of this can be validated by society level measures?

The PESH – Political, Economic, Social and Health – Correlates

Rentfrow & Co used a variety of so-called PESH variables, and some general demographic variables. They then calculated correlations between them and state prototypicality, that is to say the measure of how well a state fits the personality profile of its region. And here is what they came up with,

PESH Friendly & Conventional Relaxed & Creative Temperamental & Uninhibited
Women -0.22 -0.16 0.39*
Non-Whites -0.26t 0.52* -0.10
Median Age -0.18 -0.17 0.44*
Votes Republican 0.50* -0.35* -0.42*
Mainline Protestant 0.43* -0.49* -0.24*
Wealth -0.42* 0.35* 0.28*
Human Capital -0.50* 0.47* 0.26t
Innovation -0.42* 0.45* 0.22
Social Capital 0.34* -0.37* -0.14
Social Tolerance -0.38* 0.54* 0.08
Violent Crime -0.17 0.24t 0.01
Residential Mobility 0.12 0.27t -0.38*
Well-being -0.23* 0.47* -0.06
Health Behavior -0.46* 0.56* 0.15

The correlations marked with a * are at the 5 percent level and those marked “t” is at ten percent. As you can see the PESH variables in many ways show what we would expect from the personality profile of the regions. As the maps suggest, these regions are also fairly concentric – the geographical center is also the most prototypical part of the region and then states become gradually less so the further out from the center they are located. And given that the PESH correlations are based on prototypicality we would expect these variables to follow the same pattern. But we would expect wrong…

Things Fall Apart; the Center Cannot Hold

For instance, the FC region has the strongest positive correlation to political conservatism. This region has a core consisting of six states: Iowa, Minnesota, South Dakota, Nebraska, Missouri and Wisconsin. Rentfrow measured political conservatism as the tendency to vote Republican, by using a combination of percentages of votes for George W Bush in 2004 and John McCain in 2008. Now, I’m no statistician but if this measure correlates 0.50* to how typical a state is of the FC region I would think the most typical states would be the most Republican and then gradually less so in a concentric fashion. But looking at the results (in the link above) for 2008 we find that Obama actually won three core states – Iowa, Wisconsin and Minnesota. And the rest of the core states were not nearly as big victories for McCain as they were in the more remote and less typical states in the South.

It’s also worth mentioning that voting results are most likely affected by the personal style and charisma of the candidates as well as specific issues that may be important in one election and region but not the other. Gallup measure of political conservatism (and liberalism) more directly by simply asking people. In the core states 36.2-42.9 percent identify as politically conservative, which is slightly above the national average of 36.9. And again the southern states that fit the profile less well score much higher, with an interval of 41.8-47.9 percent. So again, we find the same reversed pattern where the PESH variable is the strongest in the states that are less typical of the region.

Same thing with religiousness, which was measured with mainline Protestant affiliation, a rather narrow measure the source of which I haven’t been able to retrieve. But since Gallup also tracks Protestant affiliation it should make a fairly good substitute. Again, it turns out we have a weak center and a strong periphery: the six core states have an average of 55.5 percent Protestants while the southern states average at 75.2 percent. No overlap between the core and peripheral states.

Further, the economic wealth measure is a composite which I can’t reconstruct because they don’t explain how it’s defined, but it’s based on things like GRP, median household income per capita, poverty rates etc.  With a correlation between this wealth measure and state prototypicality of -0.42* the implication is that the FC region is poor. I didn’t find median household per capita but I looked at the similar measure per capita income for the same year (2007).  While the six core states were slightly below the national average we again find that the southern states are way lower, again with no overlap between the richest southern state and the poorest core state. Or we can look at poverty rates, here from 2008 which is around the same time Rentfrows data are from,

Poverty by State

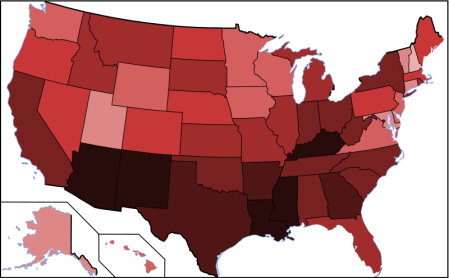
As you can see, it’s the same thing again: the core states have fairly little poverty but the less typical southern states have plenty. Yet again, there is no overlap.

A Flyover Bias?

Whether intentional or not, I find this highly misleading. I’m not sure what makes Rentfrow do this but I have a suspicion it may be a liberal bias against the “flyover states.” This bias can be seen when comedian/pundit Bill Maher recently interviewed actor Bruce Dern and dismissed Nebraska as old and poor. As I’ve shown in a previous post, Nebraska is not at all poor – unlike California which has the highest poverty rate in the country – and its median age, according to US Census 2010, is 36.2 years, one year higher than that of California but still below the national average. Since some 95 percent of personality and social psychologists are liberal and plenty admit to a rather hostile bias against conservatives, this shouldn’t come as a big surprise.

The Real FC Region: The Friendly Midwest

But let’s not throw out the baby with the bathwater. If we restrict this region to only the most typical states, the core, then we have something that looks homogeneous and concentric in terms of both personality, geography and society level correlates. They are east Midwesterners, they are indeed friendly and conventional, but in contrast to what the study suggested, they don’t stand out in any conspicuous way. They are moderately conservative and religious, they earn slightly less money than the average but they also have slightly less poverty and crime. And that’s pretty much what you’d expect from friendly and conventional people.

The RC Region: Creative and Relaxed, But Also Violent and Poor

It’s also easy to spot a similar but positive bias for the RC region. For instance, the correlation with violent crime is only slightly elevated at 0.24 at the ten percent level. But if we look at murder rates, we again see how peripheral and less typical states, like Idaho and Utah with really low murder rates, help keeping the region looking relatively peaceful. But of the most typical core states, California, Oregon, Nevada and Arizona, only Oregon is below average.

The correlation to wealth at 0.35* looks good and in line with what you might associate with a modern and open-minded region. As I mentioned above, the measure of wealth is complex and not explained in the article so again I looked at per capita income for 2007 (the year his index is based on) from the US Census. The core states are in the range 33K-41.6K dollars with an average of 37.5K, slightly below the national average of 38.6K, (although slightly above the FC core of 36K). The peripheral states have smaller incomes. I’ve already shown the poverty map above and that doesn’t help either. Somehow Rentfrow manages to make this region look wealthy but it seems to be an artifact of his calculations and perhaps wishful thinking.

The Real RC Region: The Left Coast

Again, this is not to say that the Relaxed & Creative region doesn’t exist, but like the FC region, it would become more homogeneous and meaningful if limited to a smaller area, in this case the coastal states. This is not just a matter of bias, but also how these calculations are made. I’m no statistician but Utah, although in the periphery is clearly marked on the map above as part of this region even though it is slightly above average in extraversion, agreeableness, conscientiousness while slightly lower in openness. It seems to fit this region by virtue of low neuroticism alone. And half the country is low in neuroticism. Have a look for yourselves at the eight main states of this region, traits listed in the order extraversion, agreeableness, conscientiousness, neuroticism and openness,

Oregon          30.9, 59.1, 45.8, 39.5, 58.8

Washington   30.6, 55.8, 45.0, 36.9, 56.6

California       51.4, 49.0, 43.2, 39.1, 65.0

Arizona          50.6, 46.6, 58.4, 38.1, 54.7

Nevada          46.4, 31.8, 55.8, 44.0, 61.3

New Mexico    32.4, 45.4, 58.5, 51.6, 62.0

Idaho             40.7, 52.9, 44.5, 44.2, 44.7

Utah               55.8, 69.4, 54.5, 30.4, 47.7

As you can see, Oregon and Washington are virtually identical, while California fits fairly well, even though the state is now just above average in extraversion, possibly due to migration. This would make a region of low to average extraversion, average to high agreeableness, low conscientiousness, low neuroticism and high openness. There may of course exist other personality regions with interesting correlates too, but right now I’m going with what Rentfrow generated. If we map the modified FC and RC regions along with the original TU region on a map of social and economic conservatism and liberalism created by statistician Andrew Gelman we see how these states stick together pretty good,

Gelman

The Wicked Witch of the Northeast

When I saw how well this region fits into Gelman’s map I had a suspicion that Rentfrow got it right. But let’s check some correlates anyway. The biggest correlations are those of higher  median age and a larger female population. This is fairly easy to check since this region is practically identical to what the US Census Bureau defines as the Northeast Region. The personality version of the region has a core area consisting of Pennsylvania and Delaware in the south and every state further north up to Maine. Peripheral and less typical states are Maryland, Ohio, West Virginia and the more remotely located state of Texas. According to the Census 2010, their Northeast Region has the highest median age (39.2 years) and the lowest sex ratio (94.5 men per 100 women). The average of the core states is 95.0 and for the peripheral states it is 96.1, so that looks nice and concentric. In case you wonder about the populous states of New York and Texas, I haven’t weighted anything but their averages are 93.8 and 98.4 so that would confirm the pattern even more. As for median age, it’s a similar picture with a core average of exactly 40 years while and a peripheral average of 37.9 years.

Finally, the last big correlate, political view, again I use Gallup’s record on how many identify as politically conservative rather than the presidential elections of 2004 and 2008 for the reasons I stated above. In the core states there is an average of 31.3 percent who think of themselves as politically conservative, well below the national average of 36.8, and equally important, below the average of 38.0 for the peripheral states.

Still, these correlates are pretty neutral. Violent crime is less flattering so maybe the zero correlation to this personality region is kept low by some tricky calculations as in the RC region? A quick look at the murder stats show that the core states have 3.9 murders per 100K people as compared to the periphery which has 4.7, identical to the national average. That’s the reverse of what we’d expect but it’s only one metric that varies over time so all in all, this region looks like it makes some sense. And there is no suspicion of bias.

All in All, a Brave Effort

While I’ve been whining a lot about the liberal bias in this study, I still think this is a bold step in the right direction. After all, all behavioral traits are highly heritable so research about these regions and their behavioral correlates can only be described as human biodiversity research. And we don’t see too much of that, unless it’s unintentional. It would have been nice if Rentfrow had shown how racial/ethnic groups differ since most of the samples had that information. Such differences could explain, at least to some degree, why we have these regions. When you see the high levels of neuroticism in the Northeast, it’s hard not to think of the Irish who are plenty in that region. It would also have been great if they had measured dark traits too – I mean, this is America we are talking about : )

But I’ll get back to the issue on how these regions came to be in a later post. Right now I just wanted to introduce them – and of course to show what they really look like : )


Altruism and the Dark Side of Agreeableness

February 28, 2014
Trying a bit too hard to be nice.

That smile looks like hard work.

After reading skeptics thoughts on the moral quality of the Big Five trait agreeableness, I began thinking and digging and here is what I’ve found.

The construct of the trait certainly suggests that it’s more than “day-to-day niceness”, as can be seen by its facets,

Trust, Straightforwardness, Altruism, Compliance, Modesty, Tender-mindedness

Looks like a pretty nice guy, right? But this opens the door for social desirability skewing the score. To illustrate this, here are some test items from IPIP,

Believe in human goodness

Cheat to get ahead (reversed score)

Make people feel welcome

Love to help others

Feel sympathy for those who are worse off than my self

It’s pretty obvious that this is the sort of feel-good things people say about themselves. Still, we know that agreeableness correlates negatively to the Dark Triad so doesn’t that give it some validity? Possibly, although these correlations are fairly modest, around -0.4 as compared with the honesty-humility trait of the HEXACO model which is around -0.6.  But more importantly, an average person will probably score higher on agreeableness than a “dark” person and this will yield a negative correlation. But that doesn’t mean that whoever scores high on agreeableness will be a more modest, altruistic or empathic person than the average.

Heroes

One way of getting around these problems is to look at altruistic behavior directly. One study by psychologist Lawrence Walker and colleagues at the University of British Columbia, examined people awarded for being exceptionally brave or caring. Although they didn’t find many mean associations with personality and altruism they identified three distinct clusters that did. They named these clusters communal, deliberate and ordinary. The communal is what we’d call a Florence Nightingale type who they found was in fact characterized by a high degree of agreeableness, but also of higher conscientiousness and emotional stability (low neuroticism). The second type is a little more ambiguous, scoring high on extraversion and openness. This might be a fire fighter type but it could also be a WEIRD person; Walker exemplifies this cluster with a guy who seems very principled, suggesting the latter. Or it could be a combination: a WEIRD thrill seeker like an environmentalist who will chain himself to a nuclear power plant or something like that. The third cluster is named fairly appropriately since these people score very similar to the control group, but there was a difference in that they scored lower on openness. It’s hard to know what to make of that. Since openness correlates to IQ it could be people with lower intelligence who want to help but fail to understand or contemplate the costs involved.

To summarize, these heroes do not provide convincing support of the association between altruism and agreeableness, although a subset of them score high on this trait.

The Dictator Game

Another perspective on this issue can be found in a highly interesting study by economists Avner Ben-Ner and Amit Kramer at the University of Minnesota. They’ve used the so-called Dictator Game to examine altruism towards different categories of people as well as its association with personality. In this game one person is given money and then gets to decide how much of it he wants to share with another person. Not much of a game in the conventional sense of the word, but it creates a situation in which it’s reasonable to give something but with no real hint about how much. So the amount chosen would be a measure of altruism.

As an interesting twist, Ben-Ner & Kramer had participants (students) give to four categories: kin, collaborator, neutral person and competitor. This way they can distinguish between kin altruism and other forms, like if someone is thought of as collaborator you may give more in the anticipation that this game will lead to the possibility that the other person will reciprocate – known as reciprocal altruism. Playing against a competitor you’d might not give anything at all.

They found that on the average, people who scored high on extraversion and neuroticism while scoring low on agreeableness and conscientiousness were the most altruistic to all target groups. Openness was unrelated to altruism in this study. They also found that the relationships between altruism and the Big Five personality traits were curvilinear rather than linear, and there were differences depending on who you gave money to as well as shown below,

Altruism 2

We have something like two U curves for extraversion and conscientiousness and two inversed U curves for agreeableness and neuroticism. But none of the curves are completely symmetrical so we get max and minimum levels of altruism distributed a little differently with each trait. Extraversion shows a minimum level of altruism at around one standard deviation (SD) below the mean and max at two SDs above it and so on. We can also see that these relationships are very similar for all categories of receivers.

But these categories differ in the absolute level of altruism. Participants showed a clear tendency to favour kin (the blue line) over all others, largely independent of personality. This, as Ben-Ner & Kramer pointed out, is what we would expect given that we are products of evolution and kin altruism provides inclusive fitness. But more surprisingly, participants were almost as generous towards competitors as to neutral persons. The researchers speculate on various causes for this, the most likely in my view being that some subjects are “inequality averse or fairness prone”, or as some might put it, WEIRD and pathologically altruistic.

Behind the Veneer

But the perhaps most interesting finding is the dynamics of altruism and agreeableness. Not only is this trait – with altruism as one of its facets – inversely linked to altruism; we also find that the relationship is almost linear with very low altruism at very high levels of agreeableness. This again points to the social desirability of this trait that I mentioned earlier. It also points to a possible link to dark traits; people like narcissists and psychopaths like to convey a highly likable but unrealistic persona. Criminologists and police officers know this – lying excessively about who you are is a warning sign that the person may be a psychopath or something similar.

Another interesting finding is that although kin is favoured there is also a tendency to be relatively altruistic to collaborators, something that makes sense in view of that they would be good candidates for reciprocal altruism. But for higher than average scores of agreeableness, we can see a unique gap opening up between kin and collaborator altruism. This suggests the possibility that behind the agreeable veneer lurks not only selfishness and a potential Dark Triad personality, but also some form of clannishness. Not the in-your-face violent Middle East clannishness, but a smart and sophisticated (this sample was university students) variety; people who act nice and say the right things but who will do nothing for you in the end because you’re not family. People like the Kennedys.

It will be interesting to see if this study is replicated because altruism and clannishness are such important aspects of human behavior and there is still very little research on how they relate to personality.

And beware of really nice people. If they seem too good to be true, they usually are.


The IQ Breaking Point – How Civilized Society is Maintained or Lost

September 24, 2013
West Virgina at IQ 96. Life just below the breaking point.

West Virgina at IQ 96. Life just below the breaking point.

It’s a well-known fact that intelligence corresponds to various kinds of life outcomes at the individual level, such as income, education, drug abuse, criminality etc. A little less known is the fact that national average IQs correspond to similar outcomes on the national level. This has been shown by among others psychologists Richard Lynn and Tatu Vanhanen, who have found staggering correlations between national IQ and things like health, education, income, crime, corruption, democracy.  To give you a rough idea, here are some of the findings,

Educational measures like TIMSS and PISA correlate 0.79-0.92

Number of scientists and engineers correlate 0.61

Measures of  per capita national income (GDP, GNP, GNI) correlate 0.51-0.89

Poverty and unemployment: -0.63 and -0.76 respectively

Crime in the form of homicide, assault and rape: -0.21 to -0.82 with distinctly higher correlations for the more accurate measure of homicide

Corruption: -0.27 to -0.68, all but one study above -0.54

Democracy: 20 of 22 measures show correlations around 0.60

Life expectancy: 0.51-0.82, expect for one study that found a negative correlation (possibly a typo)

Anyway, you get the picture. All the basic requirements for modern civilization – democracy, education, wealth, health and (lack of) crime and corruption – are strongly related to national IQs.

IQ 97: The Breaking Point

Seeing these correlations, it’s easy to assume that national IQ averages would correspond to specific degrees of development – that South Korea with an IQ of 107 would be much more civilized than Australia at 98, which in turn would be fairly similar to Russia or some other country at 97. But looking at the stats this is far from the case. Instead it seems like there is a point, somewhere around 97, above which a modern civilization can be maintained and below which things abruptly begin to fall apart. To illustrate this I’ll review some of the correlations mentioned above.

GDP (PPP) Per Capita

You can’t have civilization without money. It pays for education, healthcare, police etc. If we use the national IQs from Photius.com, who appear to have the updated version of Lynn and Vanhanen’s data set (correct me if I’m wrong), and compare them with the GDP/PPP that takes local purchase power into account, we find clear support for the idea of a breaking point at 97 or thereabout. If we exclude oil nations, the top 20 with populations over one million, according to Wikipedia/IMF are,

Singapore, Hong Kong, USA, Switzerland, Canada, Australia, Austria, Netherlands, Ireland, Sweden, Germany, Taiwan, Belgium, Denmark, UK, Finland, Japan, France, Israel and South Korea.

In these top 20, there are nine nations in the 98-99 range, but only two countries below 98 – Israel and Ireland. Both can be partly explained by the fact that they receive plenty of financial aid from USA and the EU respectively. And it’s unlikely that Ireland will stay in the top 20 given its huge public debt and very high unemployment.

And if we look at more “normal” countries with IQs below 98, those without oil or rich friends, we find Slovenia with an IQ of 96 at 24th place, then Cyprus with an IQ of 91 at 26th, and Greece with an IQ of 92 at 27th. And Greece may well have lost this spot as I write this. So at 98 there are plenty of wealthy countries, but at 97 it suddenly seems to evaporate. And this isn’t just about money; if we turn to corruption we find a very similar picture.

Corruption

According to the Corruptions Perceptions Index (CPI), the top 20 countries (again with a population of over one million) most free of corruption are,

Denmark, Finland, New Zealand, Sweden, Singapore, Switzerland, Australia, Norway, Canada, Netherlands, Germany, Hong Kong, Belgium, Japan, UK, US, Chile, Uruguay, France, Austria and Ireland.

Strictly speaking this is 21 nations since Austria and Ireland share the 20th spot and it seemed a bit random to exclude the one or the other. Anyway, we find 10 countries in the 98-99 range – including the top 4 and 6 in the top 10. The only three countries below 98 are Ireland (see above), Chile with an IQ of 90 and Uruguay with an IQ of 96. Again we see how everything is fine at 98, but at 97 and below things go south.

Crime

Turning to crime, so to speak, we find the top 20 countries with the lowest homicide rates (and more than one million inhabitants) according to Wikipedia/UNODC are,

Singapore, Hong Kong, Japan, Bahrain, Norway, Austria, Oman, Slovenia, Switzerland, United Arab Emirates, Spain, Germany, Qatar, Denmark, Italy, New Zealand, China, Saudi Arabia, Sweden, Australia.

This clearly breaks the pattern since we have five nations in the 98-99 range and just as many low-IQ nations, all from the Arab world. However, if we are looking for a point at which modern civilization begins to crumble, then we shouldn’t look at dictatorships at all. They can keep the murder rate low with social control and oppression, but at in doing so they disqualify themselves as candidates for civilized societies. So if we limit our sample to at least somewhat civilized countries we get a different picture. This is of course a rather subjective method but I think we can all agree that the countries above can’t be a part of it. I have included Hong Kong but excluded China so that’s where I draw the admittedly somewhat arbitrary line. The top 20 at least moderately civilized countries with the lowest homicide rates then become,

Singapore, Hong Kong, Japan, Norway, Austria, Slovenia, Switzerland, Spain, Germany, Denmark, Italy, New Zealand, Sweden, Australia, Poland, France, Netherlands, Ireland, UK, Portugal and Serbia (IQ 89).

Again, this became 21 countries because the two last share the 20th place. We find nine nations in the range 98-99 and four countries below that. The anomaly here is Slovenia at 6th place, a country that was also a mild anomaly with 24th on the GDP per capita list. But overall, this confirms the previous findings in that there are plenty nations in the 98-99 range but at 97 or less they are few and nowhere near the top of the list.

Indeed looking at where the sub-98 countries are on these lists we find that they made places 9 and 18 on the GDP list; 17, 18 and 20 on the corruption list and 6, 18, 20, 20 on the homicide list. So they are not only few but mainly at the bottom.

Democracy

Finally, let’s have a look at the Economist Democracy Index for 2012. The top 20 nations with more than a million people are as follows,

Norway, Sweden, Denmark, New Zealand, Australia, Switzerland, Canada, Finland, Netherlands, Austria, Ireland, Germany, UK, Czech Republic, Uruguay, Mauritius, South Korea, USA, Costa Rica and Japan.

As you might expect by now, around half of these, nine, are in the 98-99 range whereas only four are below that. Again, Ireland is breaking the pattern, as are Uruguay, Mauritius and Costa Rica with IQs of 90 and 89 respectively. We also find that four of the top five have 98 IQs whereas those below this level are at 11, 15, 16 and 19.

An Index of Civilization

So what happens if we add these measures up? I did this by scoring point in reversed rank order starting from 100 for each measure to create an civilization index. A statistician can probably come up with something better, but it will give a rough idea of the overall picture. The chart below shows the result,

Civilization2

As expected, there is a general pattern of higher degrees of civilization as intelligence increases. But the most civilized countries are all in a cluster with IQs between 98 and 101. Below 98 the level drops dramatically as can be seen by the lack of dots in the upper left part of the chart. The only distinct anomaly left is Ireland which scores 360 points for the 12th spot and, less striking, Slovenia at 20th with 335. Or, given what I’ve mentioned about the Irish economy, it may be Slovenia that is the more genuine anomaly here – clearly not as horrible as it’s portrayed in the Hostel movies. At any rate, combining these factors eliminates anomalies and further strengthens the support for an idea of a breaking point at approximately 97.

America

I haven’t found any official statistics for state-level IQs in America. There are however some estimates made by the Audacious Epigone, based on the NAEP scores, and educational measures are strongly correlated with IQs. He has also set the American average at 98 which matches the figures I’ve used above. If we exclude District of Columbia, which is common in these cases since it’s full of government money and temporary inhabitants, the top 20 GDP per capita (I haven’t found any PPP numbers), are as follows,

Delaware, Alaska, Connecticut, Wyoming, Massachusetts, New York, New Jersey, Virginia, Washington, Colorado, California, Maryland, Minnesota, Illinois, South Dakota, Nebraska, Hawaii, Iowa, North Dakota and Louisiana.

As in all the previous calculations, we find that states in the 98-99 make up roughly half of the sample, once more dominating the top positions – 1, 2, 4, 6, 8. Below this level we find only three states, California with an IQ of 95 at 11th position and Hawaii with an IQ of 96 at 17th and Louisiana with an IQ of 96 at 20th place. There may be some explanations for these anomalies although I’m not that familiar with American politics. But it seems clear that California is in at least as much trouble as Ireland.

Conclusions and Implications

I’m not going to say that every conceivable measure on every conceivable level will show this pattern, but overall I think we have to conclude the existence of an IQ breaking point somewhere close to 97, at which we see drastically different outcomes depending on whether a country is above or below this level. A country can of course still fail above this point, like Italy and most likely North Korea. But a national IQ above 97 represent a necessary, but not sufficient, condition for success.

One implication, if this turns out to be true, is that immigration could pose a serious threat to the West, especially those countries and regions that are closest to the breaking point. The sad part is that since everything is going so well at 98 they may dismiss this risk. This is especially true for those countries and states who are right at 98 and whose immigrants have the lowest IQs, for instance France or Texas. As for California that state has now clearly passed the breaking point, it will be interesting to see if they will break the pattern. I suspect they won’t, given that the few countries that do fairly well below 98 (Ireland, Slovenia, Uruguay etc) are all small and lacking in diversity, which is the opposite of California.

It’s fully possible that someone else already has noted this breaking point, but since I hadn’t heard of it before and it didn’t seem like common knowledge, I figured it was worth sharing. I have no idea why 97 would be a magic number; maybe it’s just something in the human condition. I’ll be updating this article whenever I find any relevant information on this.


Book Review: The Righteous Mind – Why Good People Are Divided by Politics and Religion (2012) by Jonathan Haidt

July 24, 2013

haidt


There is a lot to be said about this book; too much for a single review, but let me just start by saying it’s been a long while since I read something this interesting. It may not be up there with Steven Pinker’s The Blank Slate and Judith Rich Harris’ The Nurture Assumption but it’s not far off. So yes, it really is a big deal, and as another reviewer pointed out, the ideas presented in it are nothing short of a revolution in moral psychology.

The Old Guard

Back in the 1900s, the dominant idea on morality was that it was a product of logical reasoning, a school of thought, represented by psychologists like Jean Piaget and Lawrence Kohlberg. According to Haidt, this theory became dominant because it accorded well with the values of the secular liberals who, now as then, were equally dominant at the Universities. We learn about right and wrong , they claimed, through rational thought. And if we are allowed to do so without the meddling of religion, tradition or other illegitimate authorities, we become modern and rational citizens, eager to build a shiny new tomorrow.

And by predefining morals as based on concepts like justice and harm rather than authority or tradition the Kohlberg and the other rationalists – without realizing it, according to Haidt – created the results that suited the zeitgeist. Caring and demanding justice for the oppressed now seemed to be scientifically proven as the morally right thing to be doing. This way of thinking prevailed up until the 1990s when behavioural genetics and evolutionary psychology was beginning to undermine the progressive hijack of science.

Haidt’s Revolution

As a student in the 1980s, Haidt had doubts regarding the contemporary view on morality in psychology. He says he remembers quarrelling with his sister as a kid and how the feeling of being right was instant and emotional.  The logical reasoning came afterwards, when he tried to explain why he was right, but he kept his skepticism to himself. When studying cultural psychology taught by anthropologists, he found that among some people, you could kill a complete stranger for no good reason and the deed would increase your status. And in some cultures it was immoral to eat certain foods.

It seemed that moral psychologists only had one piece of the puzzle. This revelation and following research, including a visit to India, eventually resulted in Haidt presenting his six moral foundations – Care/harm, Fairness/cheating, Liberty/oppression, Loyalty/betrayal, Authority/subversion and Sanctity/degradation.  According to his theory, all these foundations are to some extent used by most people in forming moral judgments, although they vary by things like culture and ideology and individually as well.

Two Tribes: the WEIRD and the Old-Fashioned

In researching the foundations, he found that two patterns emerged. Westerners, liberals, adults, educated, upper class people had a tendency to rely mainly on Care/harm and to a lesser degree on Fairness/cheating and Liberty/oppression.  Non-westerners, conservatives, children, uneducated, lower class people on the other hand relied more evenly on all foundations. The first category of people is similar to what anthropologists refer to as WEIRD – Western, Educated, Rich, Democratic. He found this pattern by confronting people  with so-called harmless taboo stories like these,

A family’s dog was killed by a car in front of their house. They had heard that dog meat was delicious, so they cut up the dog’s body and cooked it and ate it for dinner. Nobody saw them do this.

A man goes to the supermarket once a week and buys a chicken. But before cooking the chicken, he has sexual intercourse with it. Then he cooks it and eats it.

WEIRD people, relying heavily on Care/harm, were the least likely to say that these behaviors were wrong. They were often disturbed by the actions described, but argued that as long as no one was harmed it was their choice. Although later Haidt hints at the fact that even WEIRD people probably make moral judgments on other foundations even though they may not be keen to admit it. As an example he mentions the piece of art known as Piss Christ, a crucifix submerged in urine, and wonders if a “Piss Martin Luther King” would be equally acceptable to the WEIRD. For some reason they are unwilling to admit that they rely on other foundations. Holding something sacred, relying on the Sanctity foundation, may feel awkward to a modern and rational person.

Visceral, Not Cerebral

And like his quarrels with his sister, he found that moral judgments in general are immediate and emotional, rather than cerebral and deliberate. To prove this he made some clever studies in which he gave participants tasks involving making moral judgments. He then introduced time limits and distractions – factors that lower the quality on cognitive tasks. The quality remained intact – people tend to know what’s right and wrong instantly. Haidt concluded that moral judgments are more like intuitions or gut feelings than rational thought, which only comes after the fact when people justify their judgments.

So Where Do Morals Come From?

But if we can’t reason our way to what’s right and wrong, then how do we do it? Part of it is in our DNA – moral foundations correlate with personality traits (you might actually think of them as personality traits) that are known to have a high heritability. The other part is social; people usually conform to the morals in their culture, and they usually change their mind on moral issues as a result of social influence rather than by private contemplation. This is for instance seen in the fact known to advertisers – repeated exposure makes for a positive judgment. And friendliness tends to be a better way of persuading people than reasoning. It all point to morals as something we acquire to fit in and get along. This is also found in politics where people often vote with their groups and against their self-interest.

Haidt claims that morals originated with shared intentionality. We developed this ability to hold a common idea and act on it. One man holds down the branch and the others pick the fruit. Chimps can’t do things like that. This common understanding was the seed, it meant that there was a right way of doing things and that letting go of the branch before the others had picked any fruit was a crappy thing to do. So as our ability for shared intentionality evolved so did our ability to cooperate. Which made the righteous person a team player.

Our Hivish/Clannish Nature

How far did the moral/cooperation trend take us? Haidt points out that colonial insects have outcompeted nearly all solitaries and that humans by excellence in cooperation have achieved a similar dominance. He speculates that group selection can have created individuals who can set their self-interest aside, at least under certain circumstance, and like colonial insects view the hive as the main priority. War would be one such circumstance, but Haidt also mentions rituals, like dances, marching and such ceremonies as a way to connect to our hivish nature.

Exactly how hivish we are remains to be seen. Colonial insects are clones so their evolutionary self-interest coincides with their group. Clearly Haidt could have benefitted from Human Biodiversity, especially the findings of hbd chick* that show how the most closely related also are the most hivish/clannish. Since humanity has lived in small isolated groups inbreeding must have created a selection for kin altruism. Since this way of living ended fairly recently, we could still have this hivish /clannish/tribal nature, even without any type of group selection.

Religion – It’s Not What You Believe, It’s Who You Believe It With

WEIRD people have a tendency to be skeptical of religion. They look at the various beliefs in supernatural agents and conclude that it’s an unhealthy thing, similar to a disease of the brain. The general idea behind this view is that if you believe in crazy things, you will eventually do crazy things and cause harm to others. But according to Haidt, religion is not about the beliefs per se, but about creating group cohesion with the foundation of Sanctity. And it can do so effectively even between people who are unrelated.

As an example, he mentions the research on communes in America done by anthropologist Robert Sosis. Communes are intentional communities built either on secular or religious ideas. Sosis looked 200 communes in America and found that after 20 years that only 6 percent of secular communes where still alive while 39 percent of the religious communes were still active. He also found that an important key to survival was sacrifice – the more people gave up for the commune the longer it lived. But this only held for religious communes. It seems, Haidt argues, that Sanctity, is needed for a sacrifice to make sense. Only if you hold something sacred will you truly make a sacrifice, otherwise it’s just a transaction. And if you hold something sacred and share it with a group of like-minded people you are more likely to stick together than if you are a secular who is always wondering if the commune is a good deal for you or not.

In line with these findings, Haidt mentions other research in economics that point to the cohesive power of religion. One example from German researchers is in the form of a game in which a so-called truster is given an amount of money in each round that he may share in part or fully with another participant, called the trustee. Any money transferred is then tripled by the experimenter and the trustee can then choose to return any or all of the money back to the truster. It turns out that when the truster is informed (truthfully) that the trustee is religious, he will transfer more of his money to him than if he is nonreligious. And, equally important, the religious trustee will in fact give back more money than a nonreligious trustee would.

This game is played out in real life too, for instance among Orthodox Jewish diamond merchants, a trade in which trust can lower the transaction costs. And it probably happens all over the world as people of the same faith do business on a hand shake rather than with lots of costly paper work.

As seen in this experiment religious cohesion even reaches out to outgroups. Haidt quotes political scientist Robert Putnam whose findings suggest that religious people make good citizens,

By many different measures religiously observant Americans are better neighbors and better citizens than secular Americans—they are more generous with their time and money, especially in helping the needy, and they are more active in community life.

Putnam’s findings indicate that while religious people are more generous to their own, they are as generous as nonreligious towards outgroups. An atheist may argue that the religious vote for lower taxes and that evens the score, but time spent in community life is not something you can get back that way.

The Culture War

 The liberal/WEIRD/atheist dismissal of religion is according to Haidt a part of the ongoing culture war between people using different moral foundations. I think he fails to explain why this war has escalated in recent years, especially in America, but there is no doubt that this trend is real and not just a media dramatization. In 1976, 27 percent of all Americans lived in landslide counties which Democrats or Republicans won by 20 percent or more – today 48 percent live in landslide counties,

Our counties and towns are becoming increasingly segregated into “lifestyle enclaves,” in which ways of voting, eating, working, and worshipping are increasingly aligned. If you find yourself in a Whole Foods store, there’s an 89 percent chance that the county surrounding you voted for Barack Obama. If you want to find Republicans, go to a county that contains a Cracker Barrel restaurant (62 percent of these counties went for McCain).

Haidt goes on to discuss how the two tribes, often simply referred to as liberals and conservatives, simply don’t speak the same language, but that they both need to understand the seriousness of the situation. They need to understand the morality of their opponents in order to to have a meaningful discussion. And they can probably learn something from each other.

He also points out that there is a trade-off between these cultures. A small isolated and homogeneous society (like Nebraska) is probably not going to be as exciting as a diverse and urban place like California. This is probably true although it doesn’t explain the growing animosity between states like these. If differences in moral foundations are the cause of the conflict it should have been as fierce 30 years ago as it is today.

At any rate, Haidt’s theory offers an interesting new perspective on human nature. Hopefully, the moral foundation can become a language or a tool with which these two tribes can learn to “disagree more constructively”. Here are some points that I think any liberal or conservative should consider after having read this book,

Conservatives,

You need to understand that the institutions you hold dear need reform in order to maintain their inherent values. A deeply religious gay couple will honor the institution of marriage better than a drunk straight couple who got married in Vegas for fun. And when you say, “I love you, but you’re going to hell” only the last part of the sentence rings true. You need to understand that without regulation, large international corporations will suck your country dry and then casually move on – strong government and patriotism are not mutually exclusive. Also, since you watch a TV show like Modern Family, you clearly like some of what liberal “Hollyweird” has to offer.

Liberals,

You need to understand that religion is a force of cohesion in a country that is already very splintered in many ways. You need to understand that while Piss Christ should be protected by free speech, it is not good citizenship to offend people just to get a little attention. You need to understand that diversity is the opposite of cohesion – it comes with a price. Maybe you think it’s worth it, fair enough, but don’t pretend like it’s for free. And don’t try to squeeze tax money from conservatives to “spread the wealth”. They will only get more reluctant to pay taxes. Remember that conservatives are generous; if helping out is your first priority, you will find a way to work with them.

So be nice. Otherwise, you’ll end up like Michell Malkin. Notice the way she says “shush” to her opponent and gets wild-eyed four minutes in. Although she is good looking, it’s not a pretty sight,


The Death of Enlightenment – or How Nebraska Beats California

July 14, 2013
Children of the Corn. Now that's a tightly knit community.

Children of the Corn. Now that’s a tightly knit community.

So I’ve had this ongoing discussion with the eloquent liberal blogger Santi about the state of California. We both agree that this state embodies the ideas and the spirit of Enlightenment, being liberal, tolerant, open-minded, diverse, metropolitan and so on. All good qualities that will translate to a happy and prosperous society, he claims.

To me, however, being more of a social conservative (but still open to new ideas) these qualities are more problematic. Naturally I admire the original men of Enlightenment for trying to bring some rationality and justice into the Western societies of the 1700s, but today I think this movement or trend has degenerated into destructive and irrational project. It’s all good to have a little diversity and mutual respect for each other’s differences, but at the end of the day societies are based on what we have in common – not on what sets us apart. So there has to be a limit to our tolerance. Experience tells us that the fabric of society, the things that bind people together, is blood, history, religion, traditions and the values that come out of this mix. Friends of Enlightenment dismiss this idea and claim that all we need is to agree on some house rules, and then everyone can do their own thing while respecting each other. And so the discussion goes.

But instead of discussing, I thought it would be interesting to do a match-up between Team Enlightenment, in the form of California, with Team Tradition, in the form of a state that in as many ways as possible is the opposite of California. Using the description above as criteria, I settled for Nebraska. It’s a solidly red state with more people identifying as conservative than in most states. It has very little diversity being 86 percent White (82 percent non-Hispanic White). It’s one of the most religious states and Christianity is practically the only religion. It is rural and has no metropolitan areas. Nebraska also differ sharply from California in terms of personality, judging by data compiled by psychologist Peter Rentfrow – Californians are more introverted and open to experience while Nebraskans are more extraverted, agreeable and conscientious. (The two states score about equal on Neuroticism.) So are these hicks any match for California? Let’s start by looking at some basic economic factors and then on to general well-being, crime and corruption etc. To get some general perspective I’ve also added the national average on these metrics.

Economy

First off, here is the per capita income in thousands of dollar for the time period 1990-2011 (sorry about the x-axis; my chart skills are limited), data taken from the Bureau of Business and Economic Research at the University of New Mexico,

per capita income

As we can see, California is staying on top for the entire period, but since incomes have roughly doubled during this time the relative differences are actually shrinking. To get a better idea of what is going on, I made a chart showing per capita income of Nebraska and the nation as percentages of Californian income for the same time period,

per capita percentages

Here we can see more clearly how national per capita income has been gaining on the Californian ditto, and even more so for Nebraska which has gone from 84 percent to 97 percent. That’s a very small advantage left for California and one that’s clearly diminishing in the long run. With that in mind, look at the next chart showing economic inequality,

Gini coefficient

The chart is showing the Gini coefficient, a measure of economic inequality (the higher the more unequal), data taken from Wikipedia/US Census Bureau 2010. This is probably counter-intuitive to many people – the Republican Nebraska seems to be spreading the wealth way more than progressive California. I’m not exactly sure why this is, but more stats will confirm this picture. Such as for instance poverty rates,

Poverty

Here is the poverty rate for 2011 as a percentage of the population according to US Census Bureau. Almost one in four Californians are poor. That’s the highest rate of all states and more than twice that of Nebraska. Again we see that Nebraska is spreading the wealth somehow whereas California is not. We find a very similar picture if we look at unemployment, here the percentage rates for May 2013 according the Bureau of Labor Statistics,

unemployment

And if you think that is just a fluctuation and that California with all its creative people are busy generating jobs for the future, here is Gallup’s Job Creation Index for 2012,

job creation index

Evidently, Nebraska is much better at creating new jobs which explains the low unemployment, and probably also why the state has almost caught up with the Californian per capita income and looks to surpass it in the near future.

Health and Well-Being

Still, money isn’t everything. Perhaps the diversity and sunny weather makes for a happier and healthier life? Here is Gallup’s Well-Being Index for 2012,

well-being

Overall Nebraska scores higher although in fairness, looking at some of the sub-factors, Californians eat more fruit and vegetables, exercise more and have less obesity. But Nebraska still wins this round with more people with health insurance, more people who feel their neighbourhood is getting better and fewer people having diabetes – somehow those healthy Californians are still getting more diabetes – a matter of stress or genetic differences?

Crime and Corruption

Moving on to crime. I’ve chosen murder because it’s perhaps the most robust measure in this field (although using total crime will give a similar pattern). Here is the murder rate per 100K inhabitants in 2009 according to US Census Bureau,

murder rate

As you can see, the Californian murder rate is only slightly higher than the national average, but it is more than twice that of Nebraska.

As far as corruption goes the states are fairly similar: California is ranked 81 and Nebraska 80 on the State Integrity Investigation’s ranking for 2012, a negligible difference, but this index shows some weird fluctuations that are not present in the international Corruptions Perceptions Index. For this reason I’ve used actual convictions instead, compiled by the Justice Department and visualized in an interactive map at governing.com. Here are the convictions between 2000-2010 per 10K public employees by state,

convictions

California is clearly better than the national average but is again beaten by Nebraska, having almost twice as many convictions.

Education

Like State Integrity Investigation’s ranking, there are some subjective measures of the quality of education, so I’ve focused on actual attainments in the form of NAEP scores and statistics on degrees from the US Census Bureau. Here is the current situation in terms of achieved degrees,

degrees

California has a little edge when it comes to higher education but not much. The most conspicuous difference is how Nebraska has distinctly less people without a high school degree, something that fits well with the low poverty rate.

And for a look at what the future may hold, here are the NAEP scores for 8th graders in 2011,

naep

They look similar but California is below the national average in all categories whereas Nebraska is equal to the national average on math and slightly above on reading and science. And this of course means that Nebraska wins over California in all categories. The reason is most found in the changing demographics; the Californian population is now largely Mexican and Mexico has a national average IQ of 85 or thereabout.

The Verdict

I may be engaging in confirmation bias here, seeing what I want to see, but judging by these metrics, had this been a boxing match then California would have been lying on the floor by now. California has historically attracted smart people and Silicon Valley is still the high-tech hub of the nation. But per capita income is the only metric in which California clearly beats Nebraska. And that is likely to change as Nebraska now has 97 percent of the Californian income and has smarter school children.

So why is Team Tradition winning over Team Enlightenment? I believe it’s because Team Tradition is built on common denominators – ethnic, religious and historical. That creates trust, loyalty and friendship – and that translates to less crime, and probably less poverty too as people know each other and become more inclined to help one another. It also creates more well-being (less stress and insecurity) and more efficient ways of doing business. It probably leads to more corruption sometimes, when people get a bit too friendly, but judging by this example that isn’t always the outcome.

Meanwhile, the only thing members of Team Enlightenment have in common is the idea that they don’t need to have anything in common other than a set of rules. This creates a team of strangers who have no good reason to be loyal, friendly or trusting of each other. It’s a team who will settle all their conflicts in court – or with a gun – and who will welcome any new members regardless of their qualifications or abilities. How can that team ever win?


The Connection Between Tipping and Corruption (and Tribalism)

May 17, 2013

Tipping
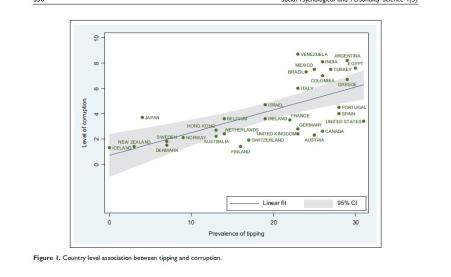
Magnus Thor Torfason, professor of Harvard Business School, and colleagues have made an interesting study on tipping and corruption, published in the journal Social Psychology and Personality Science (for a larger image click on this link). They found that countries in which tipping is common are more corrupt than others, according to the Corruptions Perceptions Index (CPI). The raw correlation is a whopping 0.6, but since other factors affect corruption these must be controlled for in order to see if there is some new unique effect linked to tipping. So they controlled for other relevant factors, namely Individualism Index, Power Distance Index, GDP per capita, income inequality, homicide rates, civil liberty restrictions, highest marginal tax rate, minimum wage and public funding of health care. When all these are taken into account there is still a unique influence linked to tipping, about half the size of GDP per capita (which btw is a rough proxy of intelligence which for some reason wasn’t included).

Two Kinds of Tipping

So what lies behind this mysterious tipping effect? Torfason’s hypothesis is that it has to do with temporal focus. It’s tipping in order to influence future behavior that he thinks is linked to corruption. Not all tipping has this temporal focus; some people will tip simply as a way of saying thanks. It’s the others, those who tip in an attempt to manipulate the person they tip, that are thinking in the same way as a corrupt person and that supposedly makes up the link between tipping and corruption.

In order to test this hypothesis Torfason & Co made secondary study comparing two countries equal in the prevalence of tipping but very different in levels of corruption – Canada and India. The participants were asked to rate how much they agreed or disagreed with statements like “I want to motivate this person to give me good service in the future.” Agreeing with this statement would obviously indicate a temporal focus on future events. They then filled in a bribery attitude measure form, judging actions like for instance whether it’s ok to bribe a policeman to avoid getting a traffic ticket.

The result clearly indicated that Indians were thinking about tipping with a temporal focus on future rewards to larger extent than the Canadians, and at the same time they were more accepting of corruption. The researchers also also crunched the numbers to ensure that the temporal focus did in fact mediate the link between tipping and attitude to corruption.

Further exploring this issue Torfason writes,

If cross-cultural differences in attitudes toward bribery are driven by temporal focus, it seems reasonable to assume that differences in temporal focus, at the individual level, will relate to bribery attitudes in the same way, even for citizens of the same country.”

To test this idea, a third study was conducted, this time using only American participants. Unfortunately, Torfason didn’t just measure temporal focus and attitude to corruption, instead he primed the participants by letting half read an article titled ‘‘Basic Tips on Tipping: Encouraging Good Service’’ and the other half an article titled “Basic Tips on Tipping: Rewarding Good Service.” I’m not sure why they did this. Perhaps they were afraid of getting to little variance from a rather small convenience sample, or maybe it was the political implications – after all, priming conceals the whole issue of whether this temporal focus (read manipulation) is a matter of personality or not. Since all known personality traits are highly inheritable, such a result would leave no doubt that Indians are inherently more manipulative than Canadians.

Corruption Is Caused by Something Much Worse than Low Intelligence

Still, even if Torfason doesn’t want to spell it out, it’s pretty obvious that this is at least in part a matter of personality. Because tipping someone in the hope that they in the future will behave in a certain manner that benefits you is by definition a form of manipulation. And manipulative behavior is an aspect of Machiavellism, a well-documented personality trait characterized by manipulative and exploitive interpersonal behavior.

Although more research is needed, this certainly adds a piece to the puzzle of personality and corruption that I’ve been discussing in a previous post. In that post I found modest correlations between nation-level corruption and Extraversion, Neuroticism and Psychoticism. These correlations suggests that the corrupt person is not just someone with low intelligence who fails to understand the long-term gains of avoiding corruption, a theory proposed by German economist Niklas Potrafke. Torfason adds further evidence linking corruption to Psychoticism, or one of its aspects, Machiavellism, a trait that along with Psychopathy and Narcissism make up the so-called Dark Triad of traits often found in criminals. Far from Potrafkes image of the corrupt person as a pretty harmless person who doesn’t quite understand what he’s doing, Torfason’s research suggests a much more sinister and calculating person.

Torfason’s  – unwanted? – discovery is for that reason more in line with hbd* chick’s theory of how high corruption levels are linked to clan-based societies. In these societies evolution has favored those with gene variants for familial altruism, creating an overly friendly attitude to relatives and an equally hostile attitude towards outsiders. This hostility, Torfason’s study suggests, goes beyond being wary of strangers or putting your own children before others. It takes the form of manipulative behavior towards outsiders. And the government is one such outsider which then explains corruption.

What Can Be Done About It?

You rarely encounter research of this kind so I can understand that Torfason is cautious, kudos to him for even going there. I’ve always liked India and I think it has loads of potential. The country actually scores higher than many other countries on Openness and Agreeableness suggesting that they have the capacity to change. But having an accumulation of anti-social traits in your population is not a joke. If India and other countries with this problem want to change, they need to face reality in order to find the solutions. There are ways of reducing genes for familial altruism, anti-social behavior or any other behavioral traits. Sadly, the PC establishment will stigmatize anyone who tries to discuss this issue, since mentioning genetic differences between peoples is Nazism, and all you really have to do is give children books to read, right? It seems the people calling themselves progressive today represent the worst kind of conservatism – the let’s-not-change-anything-that-hurts-my-feelings variety.

Extraversion, Still Relevant

That’s not to say that anti-social traits are the only possible link to tribalism and corruption. I’m still holding on to my Extraversion hypothesis, given how obviously very introverted countries like Finland and Japan have so little corruption, and, as I mentioned in my previous post, Extraversion correlates some -0.30 with corruption in Western Europe. It’s also worth mentioning that people who are overly honest and open towards strangers, tend to have Asperger-like personalities, which are characterized among other things by a very strong introversion. And anyone who has been a student has probably noticed how enthusiastic highly extraverted people are about the tribal rituals of student life, initiations and the like. Hopefully there will be some research on this too sometime in the future.

(As a fun fact, the combination of tribalism, inbreeding and anti-social attitudes is nothing new. It has been described in popular culture many times. In American films, such as for instance Deliverance (1972) featuring Burt Reynolds, the isolated inhabitants of the Appalachians are often depicted as inbred and possessing a mind-boggling cruelty towards strangers. For some reason it’s ok to exaggerate and make fun of that, probably because they’re white. But it seems political correctness draws the line somewhere between the Appalachians and Morocco.)


The Personality and Geography of the Entrepreneur

May 10, 2013

The Entrepreneurial Personality Profile

Creating new jobs is one of the top priorities for all politicians these days. This issue always ends up being discussed in terms of taxes and spending, sometimes in terms of education, but never ever in terms of people. This is ultimately the old Enlightenment view that human behavior, good or bad, is all about arranging external factors. People are assumed to respond to whatever plans or reforms the political leaders come up with.

And yet, if we look at indicators relevant to job creation it becomes clear that people do what they don’t respond the way they’re supposed to. Take self-employment for example. It has been very stable around 10-15 percent for many years now, seemingly unaffected by shifting policies. Before that it was a bit higher due to more people working in agriculture. A reason for this can be found in entrepreneur research, which shows that certain personality traits make for a good entrepreneur – just like other traits make for a good police, a good nurse etc. These traits are fairly stable over time explaining the relatively constant percentage of entrepreneurs in the American population (and most likely other populations as well).

The psychological research on people with this profession suggests that, in terms of the Big Five model, the entrepreneur profile is high on Extraversion, Openness and Conscientiousness, and low on Agreeableness and Neuroticism. The reasons for this particular mix may seem obvious, except perhaps the low Agreeableness. This is probably because an entrepreneur must be tough and not back down in negotiations. A lot of people complain about how nerve-wrecking it is to negotiate how much you should be paid with your employer, but an entrepreneur has to make similar negotiations on a regular basis, so it makes sense that they need thicker skin than the rest of us.

A Rare Commodity

By all accounts, the traits that make up the entrepreneurial profile are highly inheritable and stable from early adulthood. This means that the number of entrepreneurs (or job creators) will be limited by the amount of people who have the profile and the strength of its relation to entrepreneurial activity. So when politicians say they will create new jobs they appear to indulge in a fantasy. More realistically, they can help entrepreneurs to create jobs. Like a secretary can help an architect or a doctor to do his job more efficient.

I don’t want to sound all Ayn Rand here; I understand that the world would be pretty unpleasant without polices and nurses (and very inefficient without secretaries). We shouldn’t worship these people like some libertarians do, but at the same time we have to accept that a lot of people can be nurses and polices but few can be entrepreneurs – and entrepreneurs are more important. While other research has shown how intelligence affects the economic development, on both an individual and national level, it may be that entrepreneurship is even more important. The intelligent person can maintain the order of things, but entrepreneur is the driving force in technological development. He or she is the reason you’re reading this on a computer (or similar device), why you have fresh food stored in your fridge and why you can travel to the other side of the planet in less than two days.

So while libertarianism may be little more than a personality disorder, Rand still has a point. These individuals have a profound effect on society and to understand the world around us we need to understand them better.

Drawing the Map

One important question regarding entrepreneurship is whether all countries and regions are equally blessed with this commodity or if it’s unevenly distributed. Obviously some countries are more entrepreneurial than others, but that may be for political reasons, because while you can’t create entrepreneurs, you can suppress them. There are probably people in North Korea who have ideas and want to start businesses too.

But if we look at the personality side of this issue, international comparisons suggest that personality traits are unevenly distributed, so if two culturally similar nations had the exact same policies implemented one would still be more innovative than the other for purely genetic reasons. These international studies have been criticized since they sometimes make little sense – Japan scoring lower than Nigeria on Conscientiousness, Italians being introverted and things like that. But even with these clear mistakes, the overall results from the biggest international study of this kind are validated by culture level measures.

But we might get a more reliable test of the importance of the entrepreneurial personality by looking within nations. As I mentioned in my previous post, the data compiled by psychologist Peter Jason Rentfrow, shows an uneven distribution of Big Five factors within the United States. This means that the average levels of some states will be more similar to the entrepreneurial profile than others. But does this also mean that average levels of traits characterizing an entrepreneur on the individual level will translate to more entrepreneurial activity on the regional level?

A case for this is made in a recent study by German psychologists Martin Obschonka and colleagues, published in the Journal of Personality and Social Psychology earlier this year. They used Rentfrow’s data to create a measure of Entrepreneur-prone personality profile for the different states in America. This is what they came up with,

State-level map of the entrepreneur-prone personality

State-level map of the entrepreneur-prone personality, the darker the more entrepreneurial.

As you can see the East-West divide of Neuroticism I discussed in my previous post is present here too, although less pronounced since the other traits weigh in as well. But it’s clear that the distribution is uneven and clustered.

Obschonka then compared this ranking with measures of entrepreneurship, such as the Kauffman Index (measuring business startups) and self-employment rates. They found that even when controlling for state-level measures of prosperity, race, age and gender distribution, they got correlations around 0.35 between the personality profile and the Kauffman Index. Here is the map of entrepreneurial activity for comparison,

State-level map of entrepreneurial activity, the darker, the busier.

State-level map of entrepreneurial activity, the darker, the busier.

As expected from the correlations you can see a resemblance in that there is a cluster in the West. There are some states that break the pattern in a conspicuous way: Mississippi and Maine have the wrong profile but perform well while Nevada and Washington are the other way around. This may be due to the fact that both these measures used are fairly crude. As far as I can tell, The Kauffman Index counts all business startups – hotdog stands and high tech ventures alike. And the personality profile is built on the assumption that all traits are equally important which, if true, seems like a happy accident. (Rentfrow was kind enough to send me his data in an Excel file so when I have the time, I’ll be looking to see if a weighted measure could give a better picture of the entrepreneurial personality as well as comparing it to lots of other interesting variables).

Obschonka and his colleagues then went on the make regional-level studies of American Metropolitan areas, the UK and Germany. They got the same result with similar sized correlations but couldn’t reach statistical significance due to the small number of regions. So while preliminary, these findings suggest that their results hold not just for America but within other countries too, and most likely between countries as well.

Implications

This study is the first of its kind and the positive result no doubt means it will be followed by others. The results, should they hold up, can explain things like why people leave California for Utah or why Japan leveled out, and maybe why China isn’t the future either, but perhaps why Chile might be. It’s also interesting to note that entrepreneurial hotspots are not clearly linked to the large metropolitan areas, that are often hyped as being at the forefront of just about everything. Judging by both personality and activity it seems like states like Colorado and New Mexico show more promise than states containing larger cities, like California and New York. Then we have the fact that these clusters were most likely in part created by migrations and can be changed by future migrations.

It’s a whole new field of research opening up here – doesn’t even have a name yet but I’m sure it will soon enough – and it will be highly interesting to see what comes out of it in the future.


Book Review: Quiet – The Power of Introverts in a World That Can’t Stop Talking (2012) by Susan Cain

April 25, 2013
The author Susan Cain doing her TED talk.

The author Susan Cain doing her TED talk.

A book just about introversion? At first blush, this may seem like a too narrow focus, but according to Cain, this trait is the “single most important aspect of personality.” She makes a good case by listing the various things in life that are linked to the dichotomy of Introversion/Extraversion – choice of friends, career and education, exercise, adultery, risk-taking, delayed gratification, to mention a few.

Why America Became Extraverted

But in spite the many qualities inherent in the introverted mind, American society is still biased in favor of Extraversion, Cain argues. Already in school, the outgoing jocks and cheerleaders are popular while introverts go under labels like nerds or weirdoes, outcasts that most kids avoid. The same attitude can be found among adults, although usually expressed less bluntly. Studies show that talkative people rate as smarter, better-looking, and more interesting than the rest. This bias has even been prominent in psychology and psychiatry where introversion often has been viewed as dysfunctional or outright pathological. Adler is perhaps the best example of the academic bias (in his terminology introverts are called the Avoiding type and extraverts the Socially Useful type).

But things weren’t always like this. Cain points to what historian Warren Susman has called the transition from the Culture of Character to the Culture of Personality that took place in America in the early 1900s. This change was supposedly brought on by the industrialization and urbanization. The mass market and city life meant that you had to be able to get along with strangers in a way you never had to when living in a village or a small town. To illustrate the change, Cain presents Susman’s findings on word frequencies in self-help books and advice manuals of earlier times. In the 1800s the words that were most frequent were, Citizenship, Duty, Work, Honor, Integrity and similar. In the early 1900s these words were gradually replaced with others like Magnetic, Fascinating, Stunning, Attractive, Glowing, Dominant, Forceful and so on.

While this shift is interesting, I remain skeptical to the idea that external forces brought on such a dramatic shift in national personality. Given the how heritable personality traits are, and especially how little shared environment means, it seems more likely that this shift was due to an influx of extraverts. The early settlers were Puritans and others who came to practice their religion in peace, and they came from Northwest Europe. This no doubt was a more introverted group than the European average. When large scale immigration resumed around 1830 it wasn’t so much people fleeing religious persecution; it was people who had heard stories about the land of opportunity, and a lot of them came from Southern Europe. This demographic change seems to provide a better explanation to the emerging Culture of Personality, which perhaps more appropriately should be called the Culture of Perception.

The American Business Culture

When you compare America with Europe or the rest of the world, it’s tempting to view extraversion as an important factor in how America became so successful. Cain, however, rejects this idea. She visits Harvard Business School which is obsessed with social activities and perception – “good luck finding an introvert here” one student told her. But in real life, you’ll find loads of successful introverted CEOs, like Bill Gates, Brenda Barnes and many others. Studies linking leadership to extraversion are based on modest correlations and, more damaging, leadership is rated on impression rather than results. The personality of a good leader, Cain says, depends more on the situation. According to result-based studies, introverted leaders are good at handling active employees, putting their ideas to use, while extraverted leaders are better at inspiring passive employees, rallying the troops.

But in the business culture these insights are not taken to heart, most likely because the business world is full of extraverted salespeople who have been told and want to believe that their social skills will bring them to the top. This culture, according to the author, is irrational and destructive in that it is based on faith rather than facts. A typical example is the open office plan, which research show is linked to low productivity, high blood pressure and conflicts in the workplace – but it’s still popular because it promotes the extraverted ideal.

Cain even claims that the current Great Recession we are in right now is largely due to those pesky extraverts. That people who try to warn about potential dangers are seen as weak and ungrateful. She quotes from Kurt Eichenwald’s book Conspiracy of Fools about how when in 2001, Vincent Kaminski, a managing director of Enron, just before the bankruptcy, tried to warn about the problems his company was in and what kind of feedback he received,

There have been some complaints, Vince, that you’re not helping people to do transactions,” the president of Enron told him, according to Conspiracy of Fools, a book about the Enron scandal. “Instead, you’re spending all your time acting like cops. We don’t need cops, Vince.”

And a more general quote directly from Kaminski,

“Many times I have been sitting across the table from an energy trader and I would say, ‘Your portfolio will implode if this specific situation happens.’ And the trader would start yelling at me and telling me I’m an idiot, that such a situation would never happen. The problem is that, on one side, you have a rainmaker who is making lots of money for the company and is treated like a superstar, and on the other side you have an introverted nerd. So who do you think wins?”

I think this part of the book is very interesting, and alarming since we know that this culture is alive and well, eagerly waiting for new opportunities with little concern for the risks involved. You have to wonder if maybe places like Harvard Business School should have a quota for introverts. Not to say that introverts are better at this game – America is a great example of entrepreneurship – but it’s not the 1950s anymore, today’s world is complicated and more caution, reflection and analysis is needed.

The Introverted Ideal

It’s understandable that an introvert living in America feels unappreciated and may want to compensate for this in some ways. But reading this book it’s hard not to feel that Cain is replacing the extraverted bias with an introverted one instead. She constantly talks about the virtues of Introversion. How it’s linked to intellectual and artistic achievements, empathy, integrity, conscientiousness, persistence and so forth. Extraverts, on the other hand are generally described as simple folk who are full of energy but without any judgment or sophistication. No, she doesn’t say that but that’s what it sounds like. The title of the book alone gives you a hint of this: extraverts are the ones who can’t stop talking.

Yes, there is a bias against introverts, and yes we should do something about that. But using that as a cover for unbridled self-glorification is not an improvement.

The Biology of Introversion

More interesting is Cain’s foray into the biological and evolutionary roots of Introversion. Like me, she prescribes to the optimal arousal theory which states that variation on this trait is a matter of sensitivity. An introvert is more easily aroused and will for that reason interact with their environment in a way that keeps stimuli at a low level – staying indoors, having just a few friends they know well etc. But what kind of stimuli are we talking about? Psychologist Hans Eysenck was the first to answer this. He claimed that it was a difference in the Ascending Reticular Activating System (ARAS) that made some into introverts and other extraverts. Others, like Jerome Kagan has found a correlation between the Fight-or-Flight response and this trait, although since this is an emotional response others have pointed out that this is more related to Neuroticism. Personally, I think a sensitive ARAS could trigger the fight-or-flight response more easily making this response and indirect measure of introversion/extraversion. Then there is the theory of Reward Sensitivity, the idea that extraverts are more rewarded by stimuli. This theory would essentially make Extraversion the same thing as Sensation Seeking – a trait of thrill-seeking and hedonism.

The author presents a lot of interesting research on this although it feels like they are all finding things that relate to this trait without being able to pinpoint it. Introversion is not fearfulness or aggressiveness as measured by the Figh-or-Flight response, and extraversion is not hedonism either – there are plenty of fearful extraverts and hedonistic introverts. The nature of this trait must be something else. I think Eysenck was right on the money with his ARAS theory – at heart it is a simple matter of attention and wakefulness, although all these system appear to interact in complicated ways.

Evolution

As for the evolutionary reason for the Extraversion/Introversion trait, Cain mentions one theory by psychologist Kenneth Olson, who claims that Extraversion is the mark of the migrant, the more fearless person. This, Cain (and presumably Olson) mean, would explain why White people are more extraverted than Blacks or Asians. I can buy that Whites score higher on Extraversion than Asians, but are Africans and their descendants in America and elsewhere really that quiet and reclusive? Are African-American kids bullied in the school yard for being nerdy or socially inept and less cool than the other kids? Perhaps the Big Five, a problematic measure for sure, is to blame, or maybe it’s the incompatibility of cultures, but something is off here.

Still, the difference between America and Europe could well be that those who migrated were more extraverted, more sensation seeking and less fearful than those that stayed behind. But generally speaking I think the theory that evolution favored extraverts in a warmer climate and introverts in a cooler climate makes more sense. Cain practically admits that something like this could be a possibility when she mentions Kagan’s impression that high-reactive children (statistically related to Introversion) tend to have blue eyes more often than low-reactive children. Sadly there is hardly any research on this at all, so there is no way to know for sure. But kudos to Cain (and Kagan) for even talking about such “dangerous” notions.

Cain goes on to present various evolutionary theories. Like the simple but sensible idea that introverts add a bit of caution necessary for the group to survive. A purely extroverted group would crash like Wall Street – but with no one to bail them out.  Or Jung’s idea that Extraversion represents a strategy of high fertility and high mortality and vice versa. This would be in line with the climatic theory but it also fits with the idea that extraverts are pastoralists who are fighting to protect their cattle and most likely stealing other people’s cattle. Introverts would instead be the agriculturalists who will expose themselves to less risk and have fewer children and think more ahead. Cain mentions an interesting study about a gene variant linked to the trait Novelty Seeking, which correlates to both Extraversion and Sensation Seeking. Among Kenyan pastoralists with this variant were found to be better nourished than Kenyan farmers with the same variant. This may lend evidence to the idea that Extraversion is an adaption to a riskier and more improvised way of living. (This is also relevant to my previous post about the trait of Tribalism.)

A Yay or a Nay?

I have mixed feelings about this book. Cain’s idea of introverts as an oppressed minority, although partly true, feels a bit silly. As an introvert I object to her idea that we are “like women in man’s world.” Women are still oppressed and victimized in numerous ways whereas introverts can become both rich and powerful in any culture without anyone objecting to it.

That aside, she does write well, and although theoretically confusing, this book offers a lot of interesting facts, and she even dares to touch on some sensitive issues. So all things considered, it’s a yay.


Don’t Judge a Nation by the Size of Its Government

February 21, 2013

A recurring issue in the political debate is that of big or small government. From the political right, big government is invariably seen as an objectively bad thing. It breeds corruption and it lulls hard working citizens, and especially minorities, into a false sense of entitlement. It leads to public overspending and fiscal disaster. The left are not crazy about framing the debate in the big versus small dichotomy. They could say that big government means social security, public schools, infrastructure and so on. But since most people are naturally suspicious of the government, the term “big government” will never have a good ring to it. It just sounds too much like Big Brother (and sometimes it is). Recently president Obama even went as far as to say the following in his State of the Union speech,

It is not a bigger government we need, but a smarter government that sets priorities and invests in broad-based growth.

And he is a big government guy!

This got me thinking. Is the size of the government really objectively good or bad? There are no official measures the government size (that I know of at least) but I think total tax revenues as a percentage of the GDP could be a reasonable proxy.  I selected 38 countries that are comparable in terms of development, that is most countries in Europe and USA, Canada, Australia, and the richer countries in East Asia. I omitted really small countries since they would affect the result disproportionally. That gave me a list of 38 countries listed below, in order of size (biggest first),

  1. Denmark 49.0
  2. Sweden 47.9
  3. Belgium 46.8
  4. France 44.6
  5. Finland 43.6
  6. Norway 43.6
  7. Austria 43.4
  8. Italy 42.6
  9. Germany 40.6
  10. Netherlands 39.8
  11. Slovenia 39.3
  12. Hungary 39.1
  13. United Kingdom 39.0
  14. Spain 37.3
  15. Argentina 37.2
  16. Portugal 37.0
  17. Russia 36.9
  18. Israel 36.8
  19. Czech Republic 36.3
  20. New Zealand 34.5
  21. Poland 33.8
  22. Estonia 32.3
  23. Canada 32.2
  24. Australia 30.8
  25. Ireland 30.8
  26. Latvia 30.4
  27. Greece 30.0
  28. Slovakia 29.5
  29. Switzerland 29.4
  30. Japan 28.3
  31. United States 26.9
  32. Korea, South 26.8
  33. Croatia 26.6
  34. Belarus 24.2
  35. Lithuania 20.9
  36. Chile 18.6
  37. Singapore 14.2
  38. Hong Kong 13.0

Next, I looked up some key indicators of how well a country is doing:

1. GDP (PPP) per capita (IMF 2010-11)

2. Gross government debt as a percentage of GDP (IMF 2011)

3. Corruption Perceptions Index (CPI) from Transparency International (2012).

4. Murder rate by country according to UNODC, most recent year.

I chose murder rather than crime in general since it’s a more robust measure than lesser crimes that will be reported in varying degrees in different countries.

And then I did the scatter plots. Starting with GDP (PPP) per capita (IMF 2010-11),

Government size/tax burden on the x-axis and GDP (PPP) per capita on the y-axis.

Government size/tax burden on the x-axis and GDP (PPP) per capita on the y-axis.

As you can see there is practically no correlation at all, a negligible 0.04. Next the public debt, does big government lead to fiscal irresponsibility?

Government size/tax burden on the x-axis and gross government debt as a % of GDP on the y-axis.

Government size/tax burden on the x-axis and gross government debt as a % of GDP on the y-axis.

Again, the correlation is negligible at 0.05. But what about countries that are in real trouble? If we look at the  the ten countries with the largest debts, they have an average size/tax burden of 33.3, which is very close to the overall average of 34.0. Next we look at the Corruption Perceptions Index,

Government size/tax burden on the x-axis and Corruption Perceptions Index on the y-axis.

Government size/tax burden on the x-axis and Corruption Perceptions Index on the y-axis.

As you can see from the regression line, now we have something, a small correlation of 0.16. But note that the CPI measures lack of corruption so a higher score is better. This means that corruption actually decreases as the size of the government increases. This seems counterintuitive since big government should provide more bureaucracy for corruption to thrive on. But it’s a well-known fact that big government countries like those in north western Europe are among those with the least corruption in the world. Finally crime, or murder to be precise,

Government size/tax burden on the x-axis and murder rates per 100K inhabitants on the y-axis.

Government size/tax burden on the x-axis and murder rates per 100K inhabitants on the y-axis.

Here we a have also have a slight but negative correlation, -0.19. This is more what you’d expect since a small government means less social security and less social control, and that should translate to more crime.

So what’s the verdict? With such small correlations it’s hard to say that the data gives much support for big or small government. It may seem to lean towards bigger is better but those correlations are just too low to make much of. The conclusion is rather that government size is a matter of preference. If you value personal freedom and feel that everyone should take more responsibility for themselves, then a small government is the way to go. If you value a society that takes care of all its citizens even if it stands in the way of your personal freedom, then a big government is the answer.


Are Illegal Immigrants Taking Jobs from Americans?

February 18, 2013

Your answer to that question will probably depend on your political views. Illegal immigration is much more of concern for Republicans than Democrats. According to a Gallup 82 percent of Republicans but only 48 percent of Democrats believed that stopping illegal immigration is a top priority. And one of the common arguments for this seems to be the idea that illegals take jobs from Americans. But is there a way to objectively answer the question?

I think there is. If we look at the unemployment numbers from the Bureau of Labor Statistics and the statistics of illegals from Slate/PEW, there is a connection. If we compare these data using a scatter chart this becomes evident,

linear-regression-image.php

The X-axis shows unemployment by state and the Y-axis shows the illegal immigrants as a percentage of the state population.  The steepness of the regression line illustrates the correlation between the two variables, in this case it’s roughly 0.5. That is a clear indication that there is some type of connection.

Still, correlation is not necessarily causation. We could have a reversed causation or third factors affecting both variables. As for reversed causation, that would mean that high unemployment in and of itself would somehow attract illegals, which seems highly unlikely. After all, high unemployment means fewer jobs and that’s what they came for in the first place. As for third factors, this also looks unlikely. The bad economy is of course a global phenomenon which causes hard times both in America and Mexico, thus giving rise to unemployment as well as illegal immigration. But it doesn’t explain why illegals would seek out the states with high unemployment.

The most obvious reasons that those jumping the fence end up in certain states seems to be geographical proximity. If we look at Slate’s map chart it is clear that the border states along with Nevada, the non-border state closest to Mexico, are the most popular.

This does suggest that illegals do take jobs from Americans. And it raises some tough questions regarding the future of the border states. What happens when illegals become citizens? If they do, they will no longer be attractive on the job market. Will new illegals take their place and eventually become citizens creating a never ending influx of Mexicans to America? That, of course, is impossible – the entire population of Mexico can’t live in America.

But even if illegal immigration is stopped today, there are a lot of problems facing the border states.  When illegals become legals they can no longer boost businesses by offering lower than minimum wage pays, so tax revenues from these businesses shrink. At the same time they will become eligible for various entitlements, which will increase public spending in a time when America’s public debt is large and increasing.

It’s hard not think that  in the future this will mean that minimum wages will have to come down to fight unemployment (Californian unemployment is at 10-11 percent as it is). And the quality of healthcare, education, other public services will decrease drastically as all these new citizens will require the services but without creating any tax revenues to pay for it. If this process goes far enough the border states will in most aspects become the northern part of Mexico rather than the south western part of America.

A strategy of dimishing returns?

A strategy of diminishing returns?